User login
Language
Anonymous's groups in this site
User is not a member of any group.
Your groups across all your sites
User is not a member of any group.
Recent Content
Who's online
There are currently 0 users online.
You are here
(CLICK ON THE MAP IMAGE BELOW TO GO TO THE INTERACTIVE MAP)
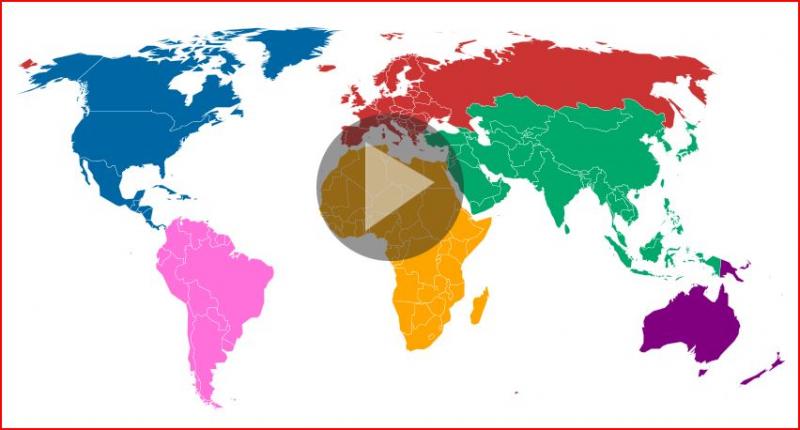
by Simon Rogers - guardian.co.uk - March 29, 2012
How can you map the world to show global data in an immediately clear way? How can you show two datasets at once to see how they compare? Kiln, a partnership of Guardian writer Duncan Clark and developer Robin Houston has come up with this beautiful new take on the globe. Watch the animated intro or click on the topics and see the map move before your eyes. Adding shading lets you compare two datasets to see how they relate – so you can see clearly how poorest countries have the fastest growing populations but the lowest emissions
• The map works best in newest versions of Chrome, Firefox or Safari
• Who made this graphic? Duncan Clark and Robin Houston
• Where can I find it? carbonmap.org
http://www.guardian.co.uk/news/datablog/interactive/2012/mar/29/carbon-map-infographic-world


Recent Comments