User login
Language
Anonymous's groups in this site
User is not a member of any group.
Your groups across all your sites
User is not a member of any group.
Recent Content
Who's online
There are currently 0 users online.
You are here
Here is the second part of my Rebalancing by Watersheds Exercise. I presented the background work recently in my Part I post. Part II contains a Concept Plan Map and a discussion of the more particular information and data that led me to the Plan.
Both Parts I and Part II are only a condensed version of the full text I prepared. Within the portions I left out for this version is a considerable amount of technical information that some readers may want to see. I will provide more of it upon request.
Again, this was only an Exercise. I performed this exercise simply to demonstrate the possibility of achieving such rebalancing. Rebalancing is an important component of a strategy for the resilience of our nation. I desire to challenge others, with the far greater knowledge and expertise needed, to conduct the proper technical research and to reformulate the conclusions of the Plan.
Initial Parameters for Concept Plan. My proposal is that we should be planning for new or considerably expanded mega-centers and mega-regions of a population size comparable to the size of some of our larger existing centers and areas, but less than the very largest ones.
Our very biggest one is the New York Urban Coast area of at least 34 million people, depending on how we define such center and area. The 34 million is just for the New York-Philadelphia area as defined by Nelson and Lang in their recent book (4). If you add the large urban areas of New England and of the Chesapeake Bay areas, its size becomes roughly 55 million people (2010). The authors identify this as the “Megalopolis Megapolitan Cluster.”
Those megapolitans (as I will call them) include, in descending order of population size (most being based on the 2010 census):
New York/North East US ...................................................................................... 55 million
Great Lakes cluster (Chicago-Detroit-Cleveland-Pittsburgh)
....................................................................................... 34.7 million
Southwest cluster (Los Angeles-Dan Diego-Las Vegas-Phoenix)........................................................................... 30.6 million
Texas Triangle (Dallas-Fort Worth-Austin-San Antonio-Houston).......................................................................... 18.5 million
Piedmont cluster (Atlanta-Charlotte)......................................................................... 15.6 million
Florida (Tampa-Orlando-Miami) ....................................................................................... 14.3 million
Sierra Pacific (San Francisco-Sacramento) ....................................................................................... 12.4 million
Cascadia (Seattle-Portland) ......................................................................................... 8.0 million
Mountain (Denver-Salt Lake City) ......................................................................................... 6.5 million
Twin Cities (Minneapolis-St Paul) ......................................................................................... 5.0 million
It is noteworthy that the top three are of enormous and disparate sizes and then the next lower four amounts are significantly more moderate and their sizes are much closer together. This suggests that the top population amount of approximately 18.5 million (or say approximately 20 million) is best suited for this Exercise.
(It should also be noted that the population counts of the megapolitans, above, do not include the population in other countries, specifically Canada. The Cascadia area (North West) clearly could include Vancouver, with over 2 million population; and the Great Lakes area certainly could include Toronto, Montreal, Ottawa and several other large cities, adding up to at least another 12 million people.)
Based on this review, I am choosing a size of approximately 10-20 million in population as my target magnitude for any new/expanded mega-center. I believe most of the even larger ones identified above are too extensive in their coverage and most should be considered as two or more megapolitans.
Secondly, I want to have some minimum target land-area size - since I want to include what I believe to be a vital “support area.” Lacking a potential support area of at least moderate size, I may be hesitant to include them in the Plan.
The total land area of the 48 adjacent states is approximately 3.1 million square miles. Of this amount, the US Department of Agriculture (USDA) estimates that approximately 50% is in land uses suggesting the land is not useable for urban development and supporting agriculture or related. (5) Thus there is an available area of approximately 1.5 million square miles for urban oriented regions for which I would like to propose a more balanced-distribution of population.
Assuming a target population of 20 million population for each (with some existing ones already being up to more than 50 million), and assuming a total of 20-25 mega-areas with 20 million population on average, each mega-area should have a land area of roughly 75,000 square miles. That is about the size of many states (e.g. South Dakota 77,116 square miles; Oregon: 98,381; New York: 54,556).
Based on my research, and the general intent of this Exercise, I am proposing that the locations meet the following criteria:
- · Near a river with an average discharge rate of a minimum of 20,000 cubic feet per second (for at least a small megapolitan);
- · Near a river with an excessive capacity to serve additional growth as illustrated by the relationship between total flow averages and total existing population – as shown in Table III;
- · In a watershed that can provide a support area of a minimum of 50,000 square miles, of reasonably tillable and developable land, at least most of which is in such watershed;
- · In a location somewhat central to such support area (if possible);
- · Generally at a moderate or larger distance from another mega-area or potential mega-area (if possible);
- · Generally favoring the middle point of the running-length of the watershed, if only one mega center is in the watershed (so that recycling of public water supplies can be distributed to a considerable amount of nearby land); and
- · Generally, if more than one mega-center is to be located in a watershed, there should be ample distance between them, as the river flows (for mixing in of intervening water flows).
Stream Flow and Population Calculations, by Watersheds. Now, in putting stream flows together with population sizes, by watersheds, I come up with Table III.
As mentioned before, I leave out most of the coastal watersheds other than one that has such enormous additional potential that it must be included: the North West Coast and the huge stream flow of the Columbia River.
TABLE III
UNUSED POPULATION CAPACITY FOR SELECTED WATERSHEDS
|
Watershed |
Square Miles in 000’s |
Current Pop in 000’s (1) |
Pop Adjust-ments (2) |
Stream flow, in 000’s cu ft per sec (3) |
Total gallons per yr, in billions (4) |
Total gallons per year, per capita |
Total Pop Capacity in 000’s (5) |
Unused Pop Capacity in 000’s |
|
|
A |
B |
C |
D |
E |
F |
G |
H |
|
Upper, Upper Mississippi just above Illinois River (a branch) |
138 |
11,100 |
Does not include Chicago metro area |
99 (individual averages, 1986-06) |
24,400 |
2,100,000 |
24,400 |
13,300 |
|
|
|
|
|
|
|
|
|
|
|
Missouri(total) * |
524 |
9,900 |
Includes only ½ of St. Louis; & only part of Denver |
84 |
19,800 |
2,000,000 |
19,800 |
9,900 |
|
Missouri – just above Platte River (a branch) |
323 |
2,100 |
|
32 |
7,500 |
3,600,000 |
7,500 |
5,400 |
|
|
|
|
|
|
|
|
|
|
|
Wash Coast (Puget Sound) area |
|
4,500 |
|
41 |
9,700 |
2,425,000 |
9,700 |
5,200 |
|
Columbia River – total * |
|
6,000 |
|
229 |
54,000 |
8,100,000 |
54,000 |
48,000 |
|
Willamette (tributary) |
|
3,300 |
|
33 |
7,800 |
3,890,000 |
7,800 |
4,500 |
|
Mid/East Washington St. (branch & trib.) |
|
2,700 |
|
196 |
46,200 |
46,200,000 |
46,200 |
43,500 |
|
|
|
|
|
|
|
|
|
|
|
Arkansas White Red Total |
262 |
13,100 |
|
87 |
20,500 |
1,600,000 |
20,500 |
7,400 |
|
|
|
|
|
|
|
|
|
|
|
Ohio Total * |
203 |
24,900 |
Includes Nashville TN |
278 |
65,600 |
2,600,000 |
65,600 |
40,700 |
|
Upper Ohio, above Portsmouth OH |
62 |
6,400 |
|
89 |
21,000 |
3,300,000 |
21,000 |
14,600 |
|
Tennessee (a tributary) |
41 |
4,600 |
Not includ. Nashville |
71 |
16,700 |
3,600,000 |
16,700 |
12,100 |
|
|
|
|
|
|
|
|
|
|
|
Saint Lawrence U. S. Canada Total ** |
… … ...519 |
…32,000 …15,000 …47,000 |
included most of Chicago |
…. …. ….435 |
…51,300 …51,300 …102,600 |
… … 2,183,000 |
…51,300 …51,300 …102,600 |
…19,300 …36,300 …55,600 |
Table footnotes to be provided upon request.
Regarding the Mississippi River and its watershed, I only focus on the Upper-Upper Mississippi, above its confluence with the Illinois River (the Illinois River being the wastewater outfall for Chicago). All the other parts of the Mississippi are considered as to their major tributaries (Missouri, Ohio, etc.), each of which is a watershed of its own. The main core of the Mississippi River has its most value in population-re-balancing-by-watershed, at least as I set up this Exercise, only as regards its lower extremity near the Gulf of Mexico.
Essentially, what I have presented might be taken as a general proviso that one should have approximately 4,200 cubic feet per second in stream flow to support each 1,000,000 in population located within the watershed of the stream and downriver of such flow.
The size of the watershed as given in Table III often reflects the size recorded at the gaging “station” where the stream flow was recorded. Normally I tried to choose the station closest to the mouth of the stream but even then, it might be 100 miles, more or less, above the mouth.
Current population numbers were my own estimates and in some cases, they reflected adjustments I made based on research and/or other judgments.
Total population capacity, as indicated in the footnotes, was based on 1,000,000 gallons per year per person. Again, this was based on both research and judgment. I believe, however, that if I erred, I did so on the cautious side.
Concerning the Saint Lawrence River, I discovered several different sources for river flow statistics that provided substantially different numbers. I used one of the more modest numbers. Moreover, I simply assumed that ½ of flow and ½ of unused population capacity might very well go to each, the U. S. and Canada. I realize that such assumption may very well not be valid and that further possibilities should be considered.
Concerning the Northwest area, I did not include the adjacent area in Canada, i.e. the Vancouver area and the Fraser River. The Fraser River carries a very large stream flow (about 123,000 cubic feet per second) and could be considered as another excellent possibility for water supported growth. Its population should be totaled in to this mega-area and the area planned in a combined fashion.
Concept Plan “A.” Going forward with this Exercise, I now present Concept Plan “A” as my personal projection of how mega-centers and mega-areas might best be distributed and/or redistributed across our nation over the next 50 to 100 years or so. It is based on my research and analysis above.
I call it Concept Plan “A” for the express intent of encouraging others to continue with the preparation of many more Concept Plans and with the absolute understanding that I am not the one to be preparing such an important proposal. I am only hoping that in seeing one possible scenario of this type, others will have the incentive and confidence to prepare more and much better of the same.
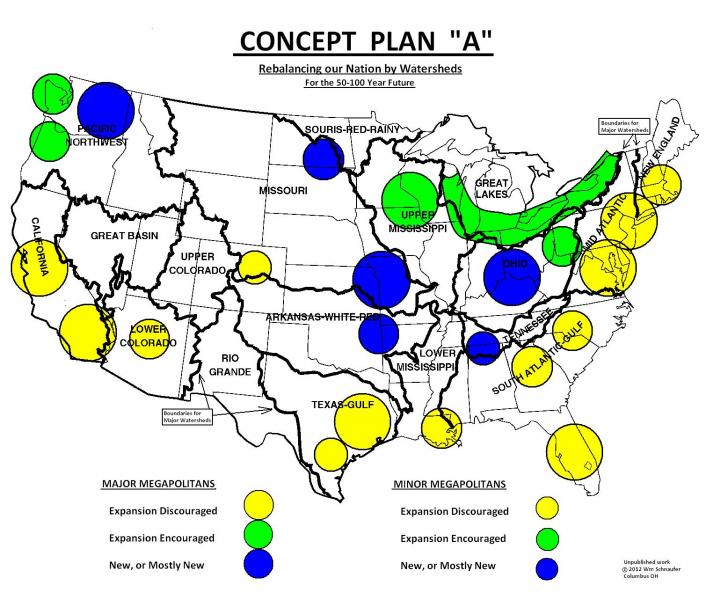
I have used two sizes of proposed megapolitans (mega-centers and mega-areas):
Major Megapolitans - having an expected population size of approximately 20 million more or less; and
Minor Megapolitans - having an expected population size of approximately 5 to 15 million.
I believe that some smaller centers, maybe even with only 5 million people, would greatly improve the adaptivity of our nation. So, for example, projecting 5 or so new 20-million population centers would not achieve as much adaptivity for our country as would projecting 3 mostly new major metropolitans and 3 mostly new minor metropolitans. (Population changes projected for this Concept Plan are estimated below in Table IV.)
Also, note that I have used three categories for each of the two sizes:
·
Expansion discouraged
·
Expansion encouraged
·
New, or mostly new
I am not certain that all three are needed for the purposes of this Exercise. However, I do believe it was and is necessary to distinguish between centers/area where additional growth should be discouraged and those where it should be encouraged. The distinction between expansion encouraged and new/mostly new was primarily my own/personal sense of whether or not a core for such a center was already well identified and of substantial size or not.
One of these, the Lower Missouri major megapolitan designated on the plan map is an appropriate example. This area already has very substantial population in its two large existing cities: Saint Louis and Kansas City. (Although the location on the map suggests Kansas City as the hub, it could have been St Louis; except that I am trying to stick with my concept that such centers should not be at the mouth of such a tributary.) On the other hand, this location is so central and strategic to the future of the US it is difficult not to want to suggest that it be thought of as something entirely new.
The proposed new major megapolitan in the Lower Ohio area is likewise of such strategic importance to the country’s future.
As a result of this Exercise, Table IV presents a summary of how I propose the population of mega-centers might grow over the next 100 years or so if we were to achieve a much better rebalancing of the populations in our nation. For the convenience of many readers, I have correlated my data with that of a well-known book, mentioned previously, and published recently by the American Planning Association, Megapolitan America – A New Vision for Understanding America’s Metropolitan Geography (6).
Table IV incorporates the Concept Plan I have prepared. It also assumes that even those centers where I have proposed that growth be discouraged will continue to grow at least at a moderate rate. It provides for an expected growth of approximately 200 million more people by the year 2100.
TABLE IV
PROPOSED CONCEPT PLAN DISTRIBUTION CHANGES
Approximately 2010-2100
|
Place (b) |
Estimated Existing Population, in millions |
Proposed Population Increase, in millions (a) |
Proposed Future Population, in millions |
|
|
|
|
|
|
North East Mega-Mega region (Shown as 3 clusters) |
53 |
11 |
64 |
|
Southwest cluster (Shown as 2 clusters – S. Calif and Las Vegas; and Phoenix area) |
31 |
6 |
37 |
|
Texas Triangle (Shown as 2 clusters) |
18 |
4 |
22 |
|
Piedmont cluster (Shown as 2 clusters - Atlanta-Charlotte) |
16 |
3 |
19 |
|
Florida cluster |
14 |
3 |
17 |
|
Sierra Pacific (San Francisco-Sacramento) |
12 |
2 |
14 |
|
Mountain (Denver) cluster (includes S. Lake City for population projection purposes, only) |
7 |
1 |
8 |
|
Great Lakes cluster (Shown as oblong cluster) |
32 |
18 |
50 |
|
Coastal Washington State area (Puget Sound area) (in North West Watershed) |
4 |
6 (c) |
10
|
|
Willamette River area (Oregon) (in North West Watershed) |
3 |
5 (c) |
8 |
|
Upper-Upper Mississippi area (including Twin Cities) |
6 |
12 |
18 |
|
Upper Ohio River area (including Pittsburgh) |
6 |
8 |
14 |
|
Saint Louis – Kansas City (in Missouri Watershed) |
5 |
10 (c) |
15 |
|
Upper Missouri River (In Missouri Watershed) |
2 |
5 (c) |
7 |
|
Mid/East Washtn State (Columbia and Snake Riv’s) (In North West Watershed) |
2 |
13 (c) |
15+ |
|
Little Rock – Tulsa area (In Ark/White/Red Watershed) |
3 |
7 |
10 |
|
Tennessee – Alabama area |
1 |
6 (c) |
7 |
|
Lower Ohio River |
10 |
20 (c) |
30 |
|
|
|
|
|
|
Subtotal |
225 |
140 |
365 |
|
|
|
|
|
|
Area outside of designated places (d) |
75 |
60 |
135 |
|
|
|
|
|
|
Total |
300+ |
200 |
500 |
Table Footnotes provided on request.
Conclusion. The purpose of this Exercise is to demonstrate the feasibility of preparing a Concept Plan for the long-term growth and redistribution of the population centers in the US that would increase the adaptivity of our country to meet any of a number of unknown and unpredictable futures. Adaptivity is enhanced with diversity and balance.
It also has the purpose of showing how such a Concept Plan can be linked to the major watersheds of our country and thus contribute to water supply dependability. It shows generally that the midsections of the nation have very large stream flows that are underutilized as supportive of population habitats. Although such stream flows have become quite important to agriculture, power plants and other non-urban uses, as discussed in the early sections of this Exercise, in many cases such functions overuse such resource simply because they can.
I believe this Exercise has been successful in meeting both purposes.
It has also demonstrated that a large portion of the nation’s projected 200 million in growth could be absorbed in places other than the three or more existing overly large megapolitans.
One more remark should be added. The planning work conducted for this Plan focused only on the contiguous 48 United States. It is obvious that such planning should be looked at and carried out, instead, in combination with adjacent nations. Planning for the Columbia River watershed, the Missouri River watershed, the Souris-Red-Rainy watershed, and the Great Lakes/Saint Lawrence River watershed should be carried out jointly with Canada. Moreover, planning for the Colorado River watershed and the Rio Grande River watershed should be carried out jointly with Mexico. All nations must work together to meet our freshwater needs.
FOOTNOTES:
(4) Nelson, Arthur C. and Robert E. Lang. Megapolitan America – A New Vision for Understanding America’s Metropolitan Geography. American Planning Association, Planners Press, Chicago and Washington D.C.: 2011.
(5) Lubowski, Ruben N et al. Major Uses of Land in the United States, 2002. Economic Research Service/USDA. At: www.ers.usda.gov/publications/EIB14/wiv14a.pdf
(6) Long term mean averages for stream flows were accessed through various Internet sites. Details to be provided upon request.
William Schnaufer


Recent Comments