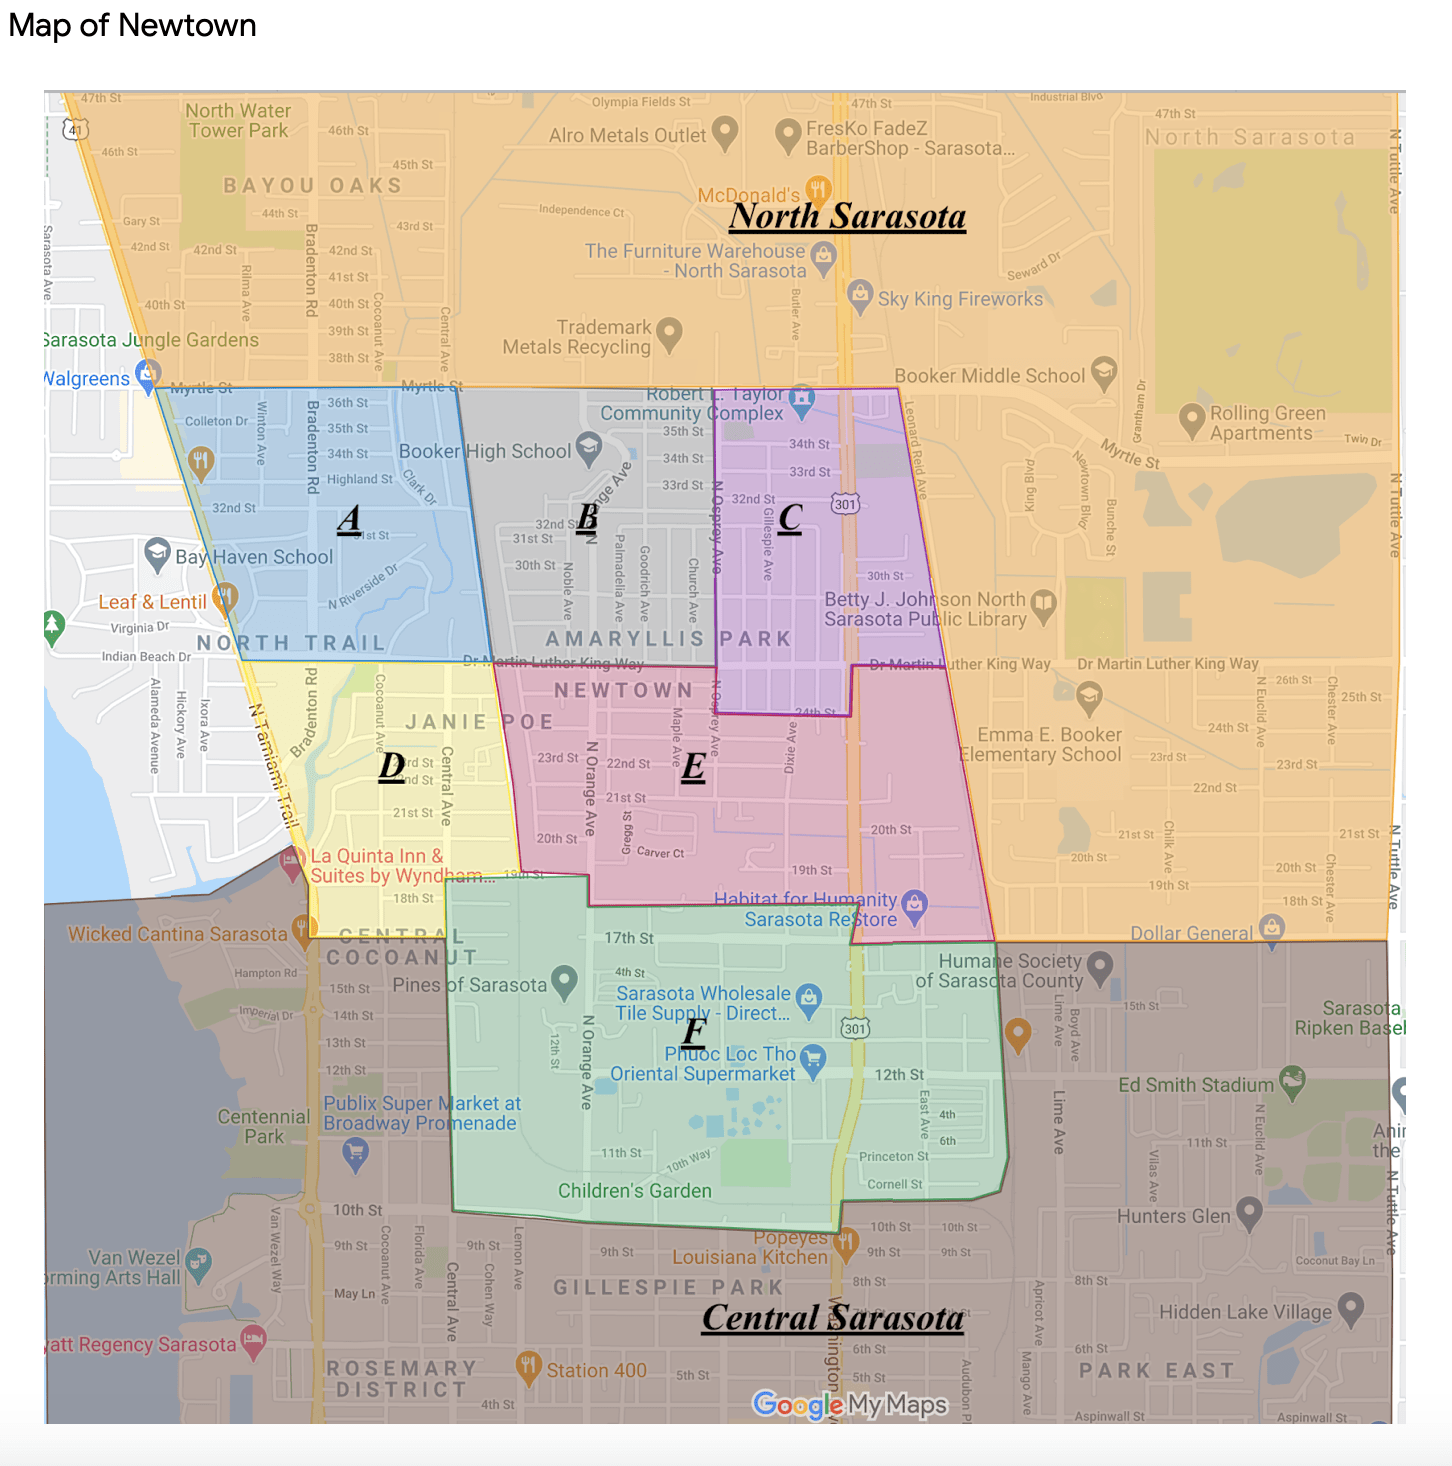
Black Icon: 4 Lack of Food Access Indicators Brown Icon: 3 Lack of Food Access Indicators
Dark Gray Icon: 2 Lack of Food Access Indicators Light Gray Icon: 1 Lack of Food Access Indicators
Both food insecurity and access to nutritious foods impact health. The map above includes data from the USDA Food Research Access Research Atlas. The black icons are locations with a score of 1, which have the the least access to nutritious foods. The brown icons have a score of 0.75, and the dark grey icons have a score of 0.5, and the light grey icons have a score of 0. Both Limited Income and Limited Access are considered in the scoring. When you click on an icon on the map, you will see:
Low Income and Low Access at 1 mile followed by a Yes or No. If labeled Yes, this means it is a low-income census tract where a significant number or share of residents is more than 1 mile (urban) or 10 miles (rural) from the nearest supermarket.
Low Income and Low Access at 1/2 mile followed by Yes means it is a low-income census tract where a significant number or share of residents is more than 1/2 mile (urban) from the nearest supermarket.
Low Income and Low Access at 1mile followed by a Yes means it is a low-income census tract where a significant number or share of residents is more than 1 mile (urban) or 20 miles (rural) from the nearest supermarket.
Low Income and Low Access using vehicle access followed by Yes means it is a low-income census tract where more than 100 housing units do not have a vehicle and are more than ½ mile from the nearest supermarket, or a significant number or share of residents are more than 20 miles from the nearest supermarket.
Data Requested by the Community
Dietary recommendations during the Covid-19 Pandemic from the Nutr Rev. 2020 Jul 12 : nuaa067 provides a summary of dietary recommendations disseminated during the coronavirus disease 2019 (COVID-19) pandemic.
Nutrition and Immunity: lessons for COVID-19 from the European Journal of Clinical Nutrition volume 75, pages 1309–1318 (2021).
“Prescribing” fruits and veggies would save $100 billion in medical costs based on this study: Cost-effectiveness of financial incentives for improving diet and health through Medicare and Medicaid: A microsimulation study in the journal PLOS Medicine.
2019 Amaryllis Park Food Stamp Demographic Information from the US Census Bureau reported in the US Demographic and Statistical Atlas
2019 Central Cocoanut Food Stamp Demographic Information from the US Census Bureau reported in the US Demographic and Statistical Atlas
Economic Research Service (ERS), U.S. Department of Agriculture (USDA). Food Access Research Atlas
The Comprehensive USDA Food Environment Atlas is a composite of many maps, including grocery stores, fast food restaurants, WIC and SNAP as well as other sources of food available in a geographic area. Unfortunately the most recent data is from 2017.

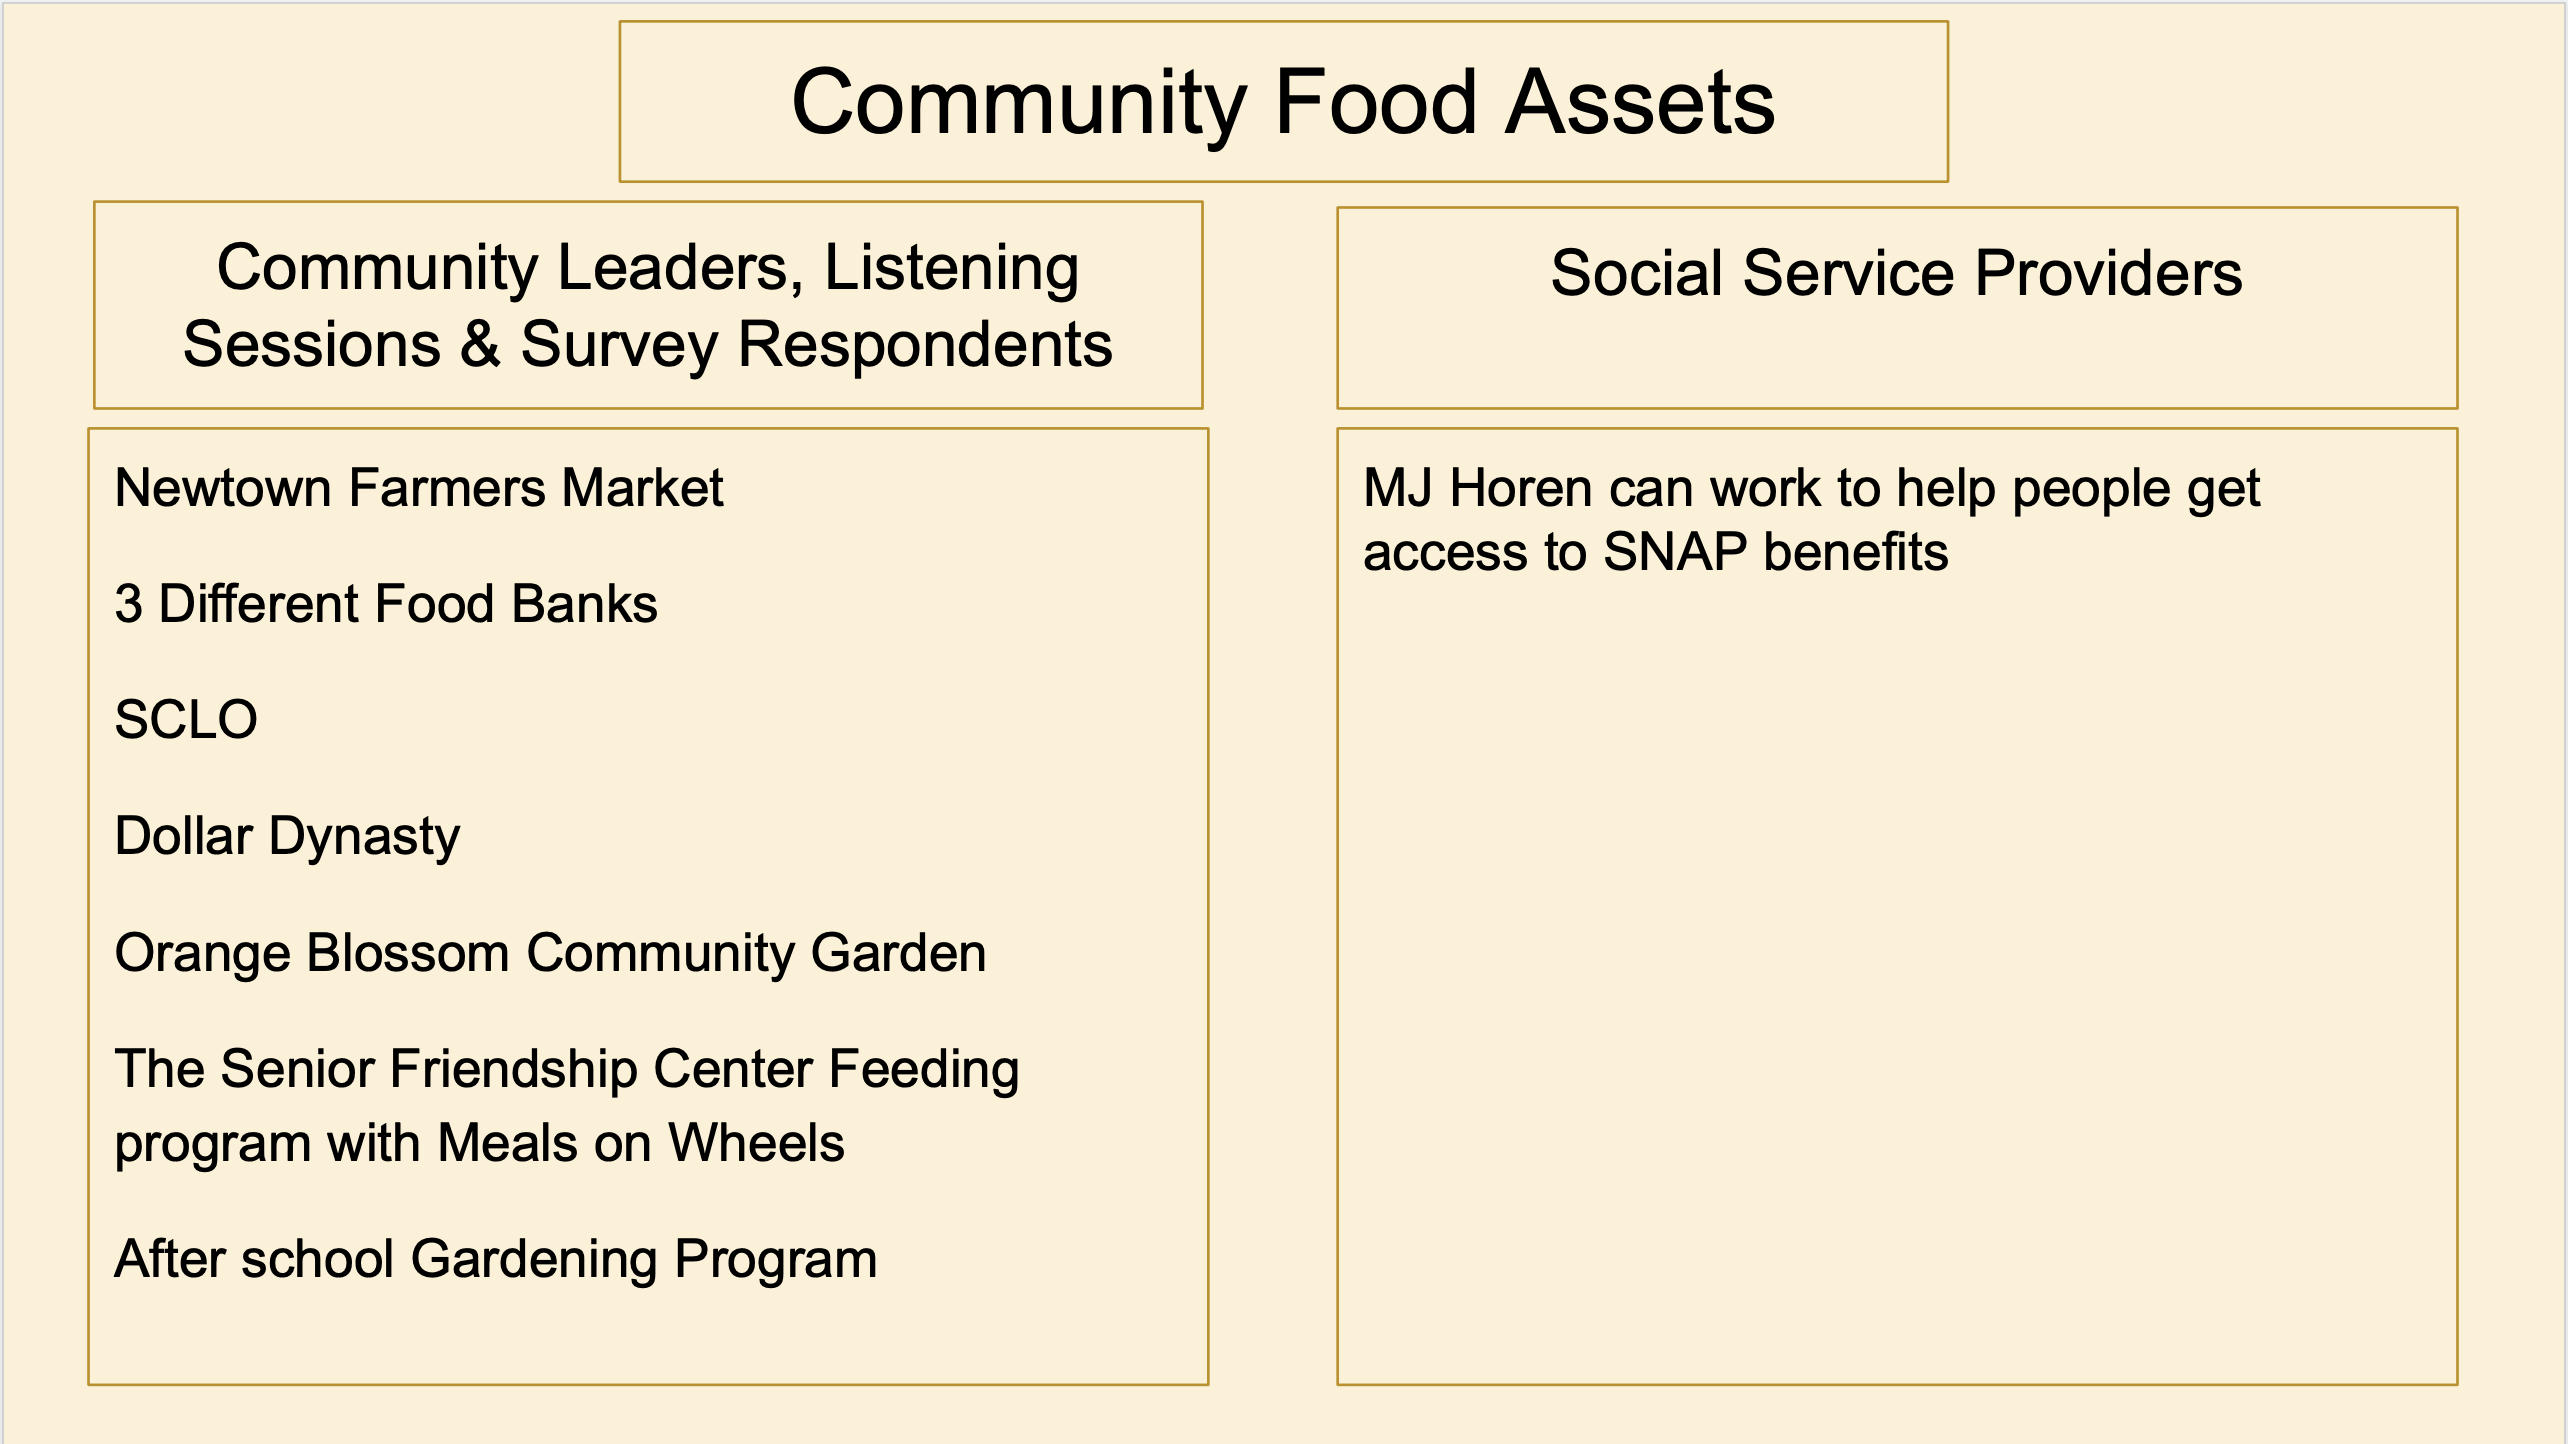
Orange Blossom Community Garden
MHI Newtown Community Ambassador Barbara Powell Harris presents survey results on food.
Voices of the Community: Survey Comments and Community Dialogue on Food

Newtown Farmers Market
Community Voice Questionnaire
Food
2021
31% of respondents stated that in the past 12 months, it was often true that they were unable to eat balanced meals. This was sometimes true for 43% of respondents and never true for 25% of respondents.
34% of survey respondents who lived, worshipped of worked in Newtown reported that in the last 12 months the food ran out and they had no money to purchase more. This was true for 44% of the people who lived in Newtown.
Balanced meals include vegetables, fruits, protein, grains and dairy foods. We couldn’t afford to eat balanced meals. Was that often, sometimes, or never true for you in the last 12 months?
- Often true 31%
- Sometimes True 43%
- Never True 25%
- Prefer not to answer 1%
Within the past 12 months, did the food you bought just not last and you didn’t have the money to get more?
- Yes 34%
- No 66%
Within the past 12 months, did you worry that your food would run out before you got money to buy more?
- Yes 37%
- No 63%

Comments People Who Live, Worship or Work
in Newtown Made About
Food
2021
Sometimes good sometimes nasty (Lives in North Sarasota, worships and works in A)
Need more food give aways (Worships in D)
Not enough food stamps some months (Lives in North Sarasota)
Healthy food costs more than junk food. (Lives in North Sarasota)
I eat it all. (Lives in E)
I’m a diabetic and I live with my daughter, and they help with the food. (Lives in E, works in B)
[no problem eating] If it’s cooked good. (Lives in A)
It’s hard to find basic needs like bread and sugar and coffee.. (Lives in E)
More vegetables are needed in Newtown. (Lives in B, worships in E)
We need to help clients know how to use coupons and shop better with help. (Lives in E, worships in B)
I eat a balanced meal daily for health reasons; that’s why my family lived over 100. (Worships in B)
I eat everyday so I am good on food (Lives in E)
EBT card/AMT Shrank (Lives and worships in North Sarasota, and works in B)
Since I provide a two parent home, both me and my husband work, so we do not qualify for food stamps or medicaid. So with me cutting my finger, and my 4 y/o becoming ill, our extra cash went on medical bills, so I had to figure out food this month. (Lives in B, worships in E)
Food is something we all need, but most foods are not good for the body (Lives, worships, and works in North Sarasota)
I don’t get food stamps, I’m disabled (Lives in B, worships in E)
food desert (Lives and worships in B, works in A)
Costs too much (Lives in E, works in North Sarasota)
Ate healthy all my life (Lives in B, worships in North Sarasota)
Food is abundant in Sarasota; you can find food if you want to (Lives and worships in North Sarasota)
Need more sit-down restaurants like other places and more available hours (Works in A)
Food Stories
Housing Authority’s After School Program brings Fresh Food to the Neighborhood
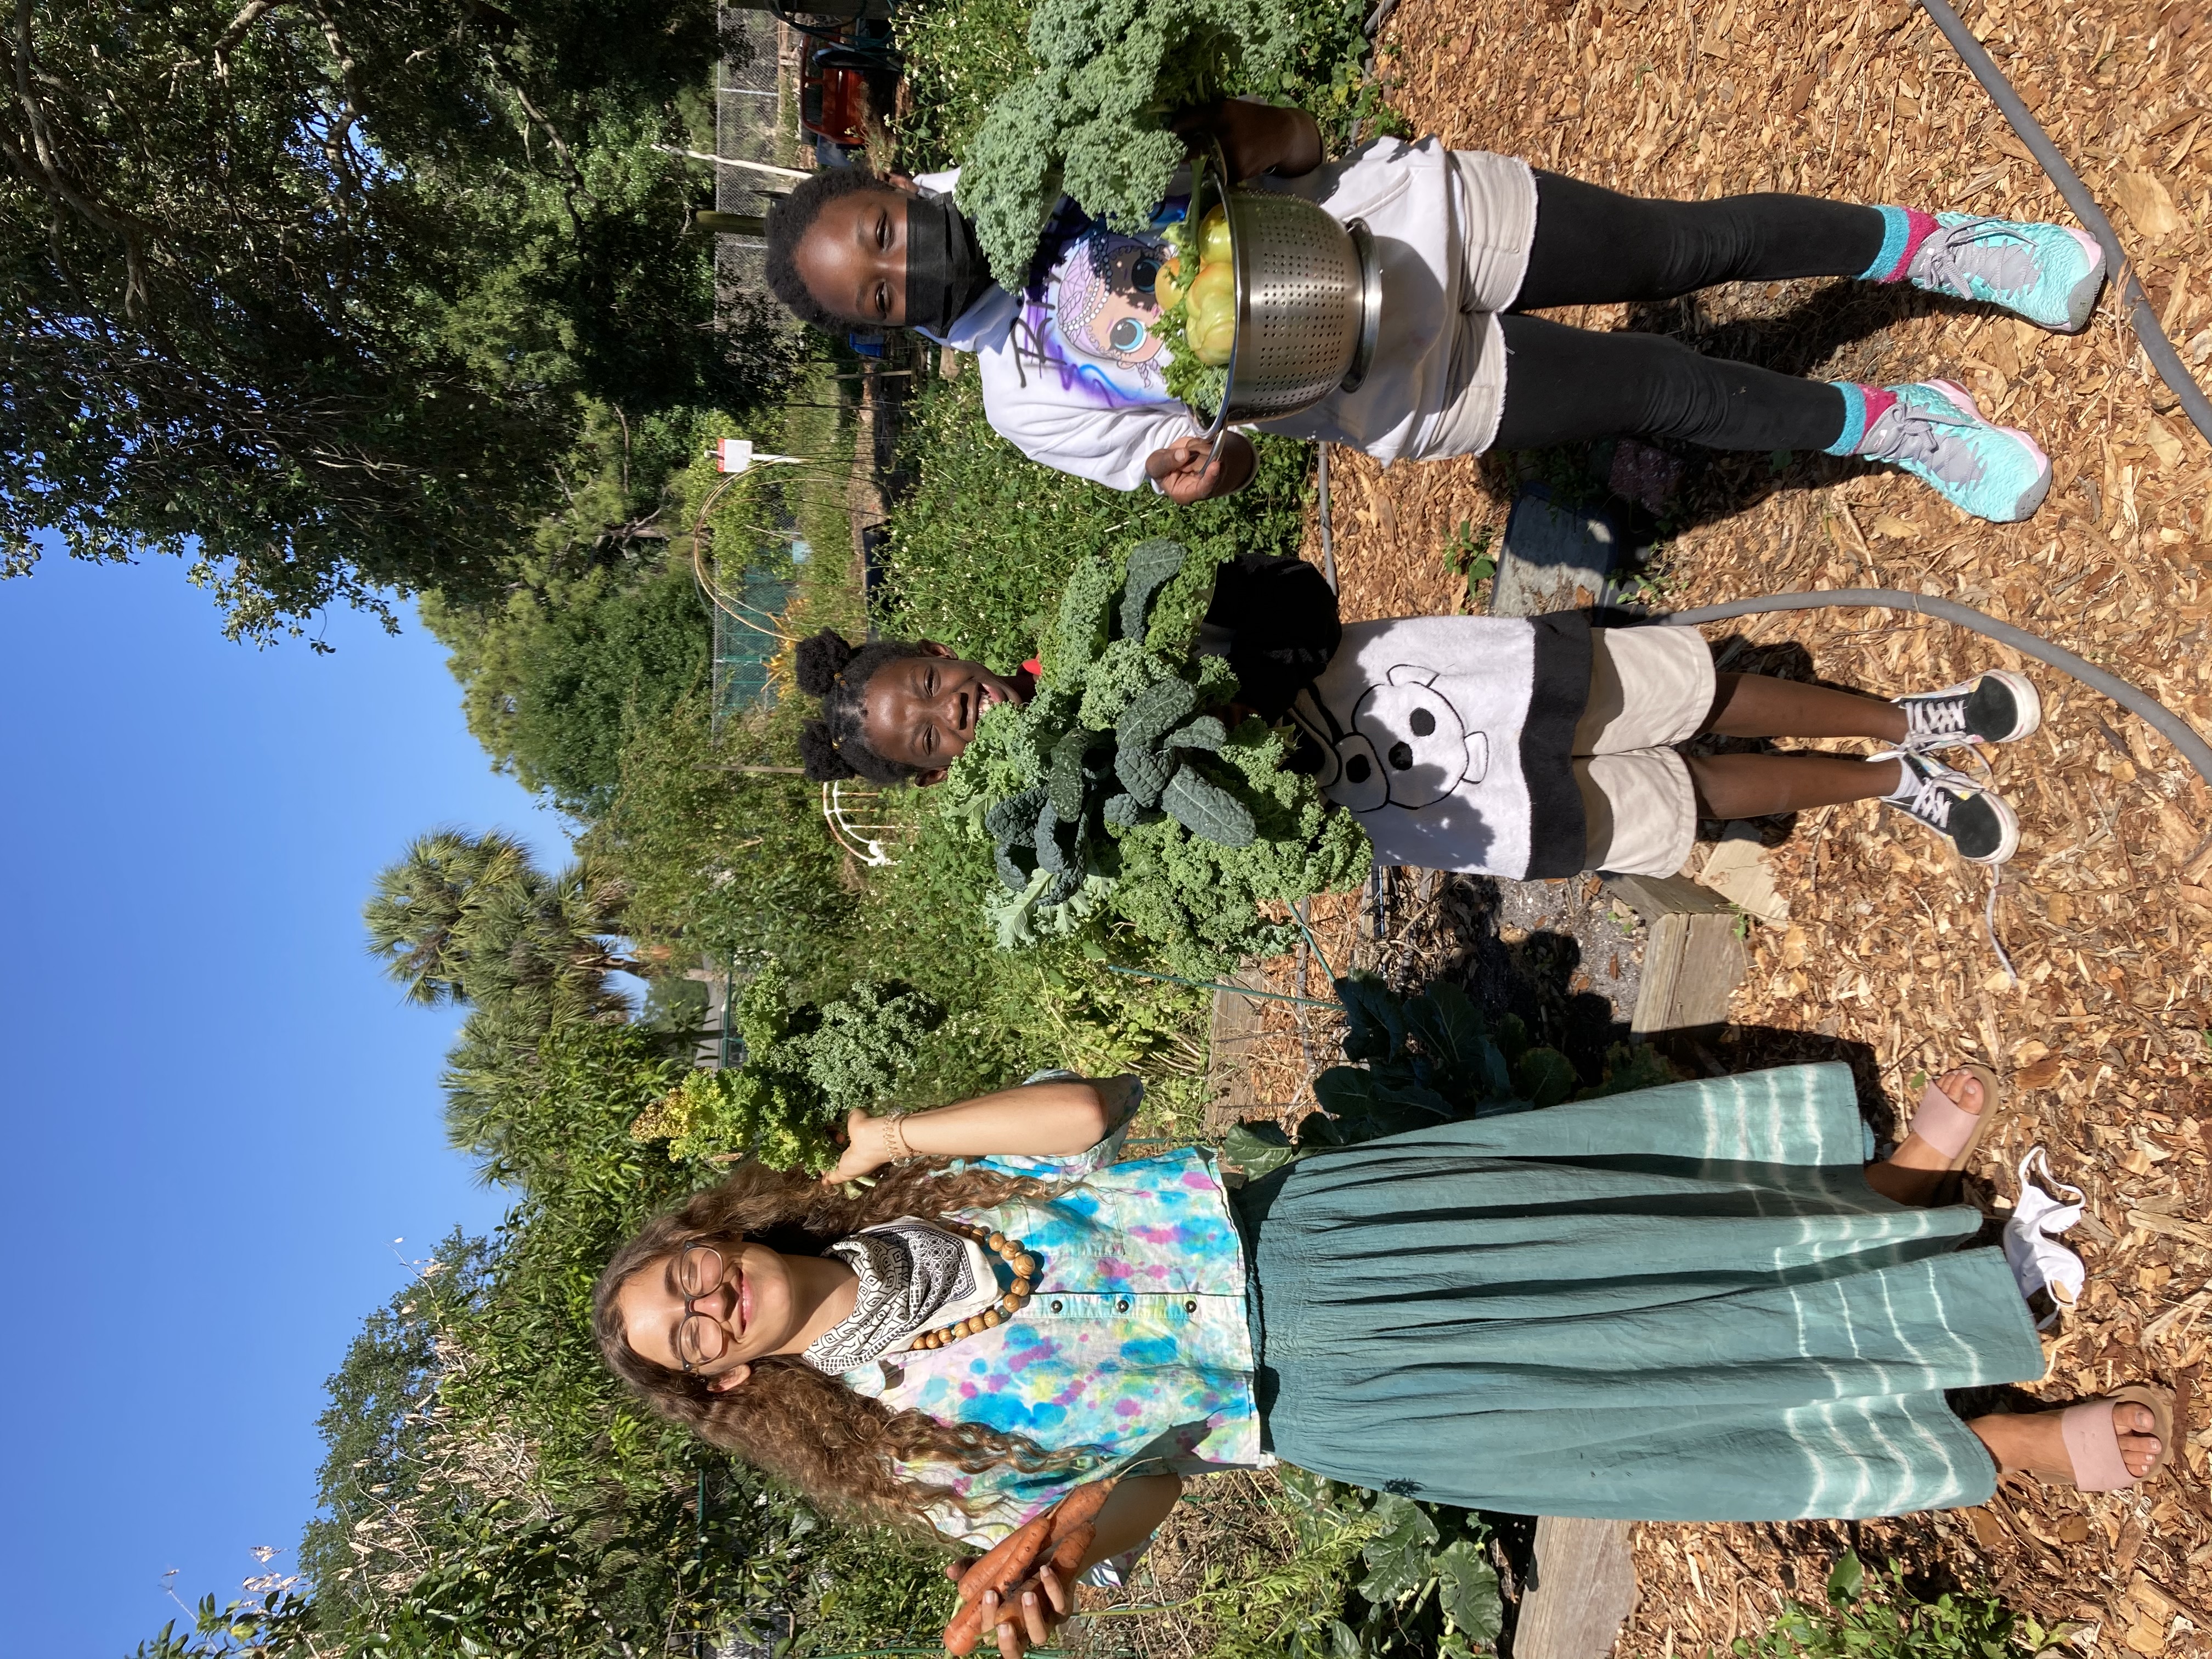
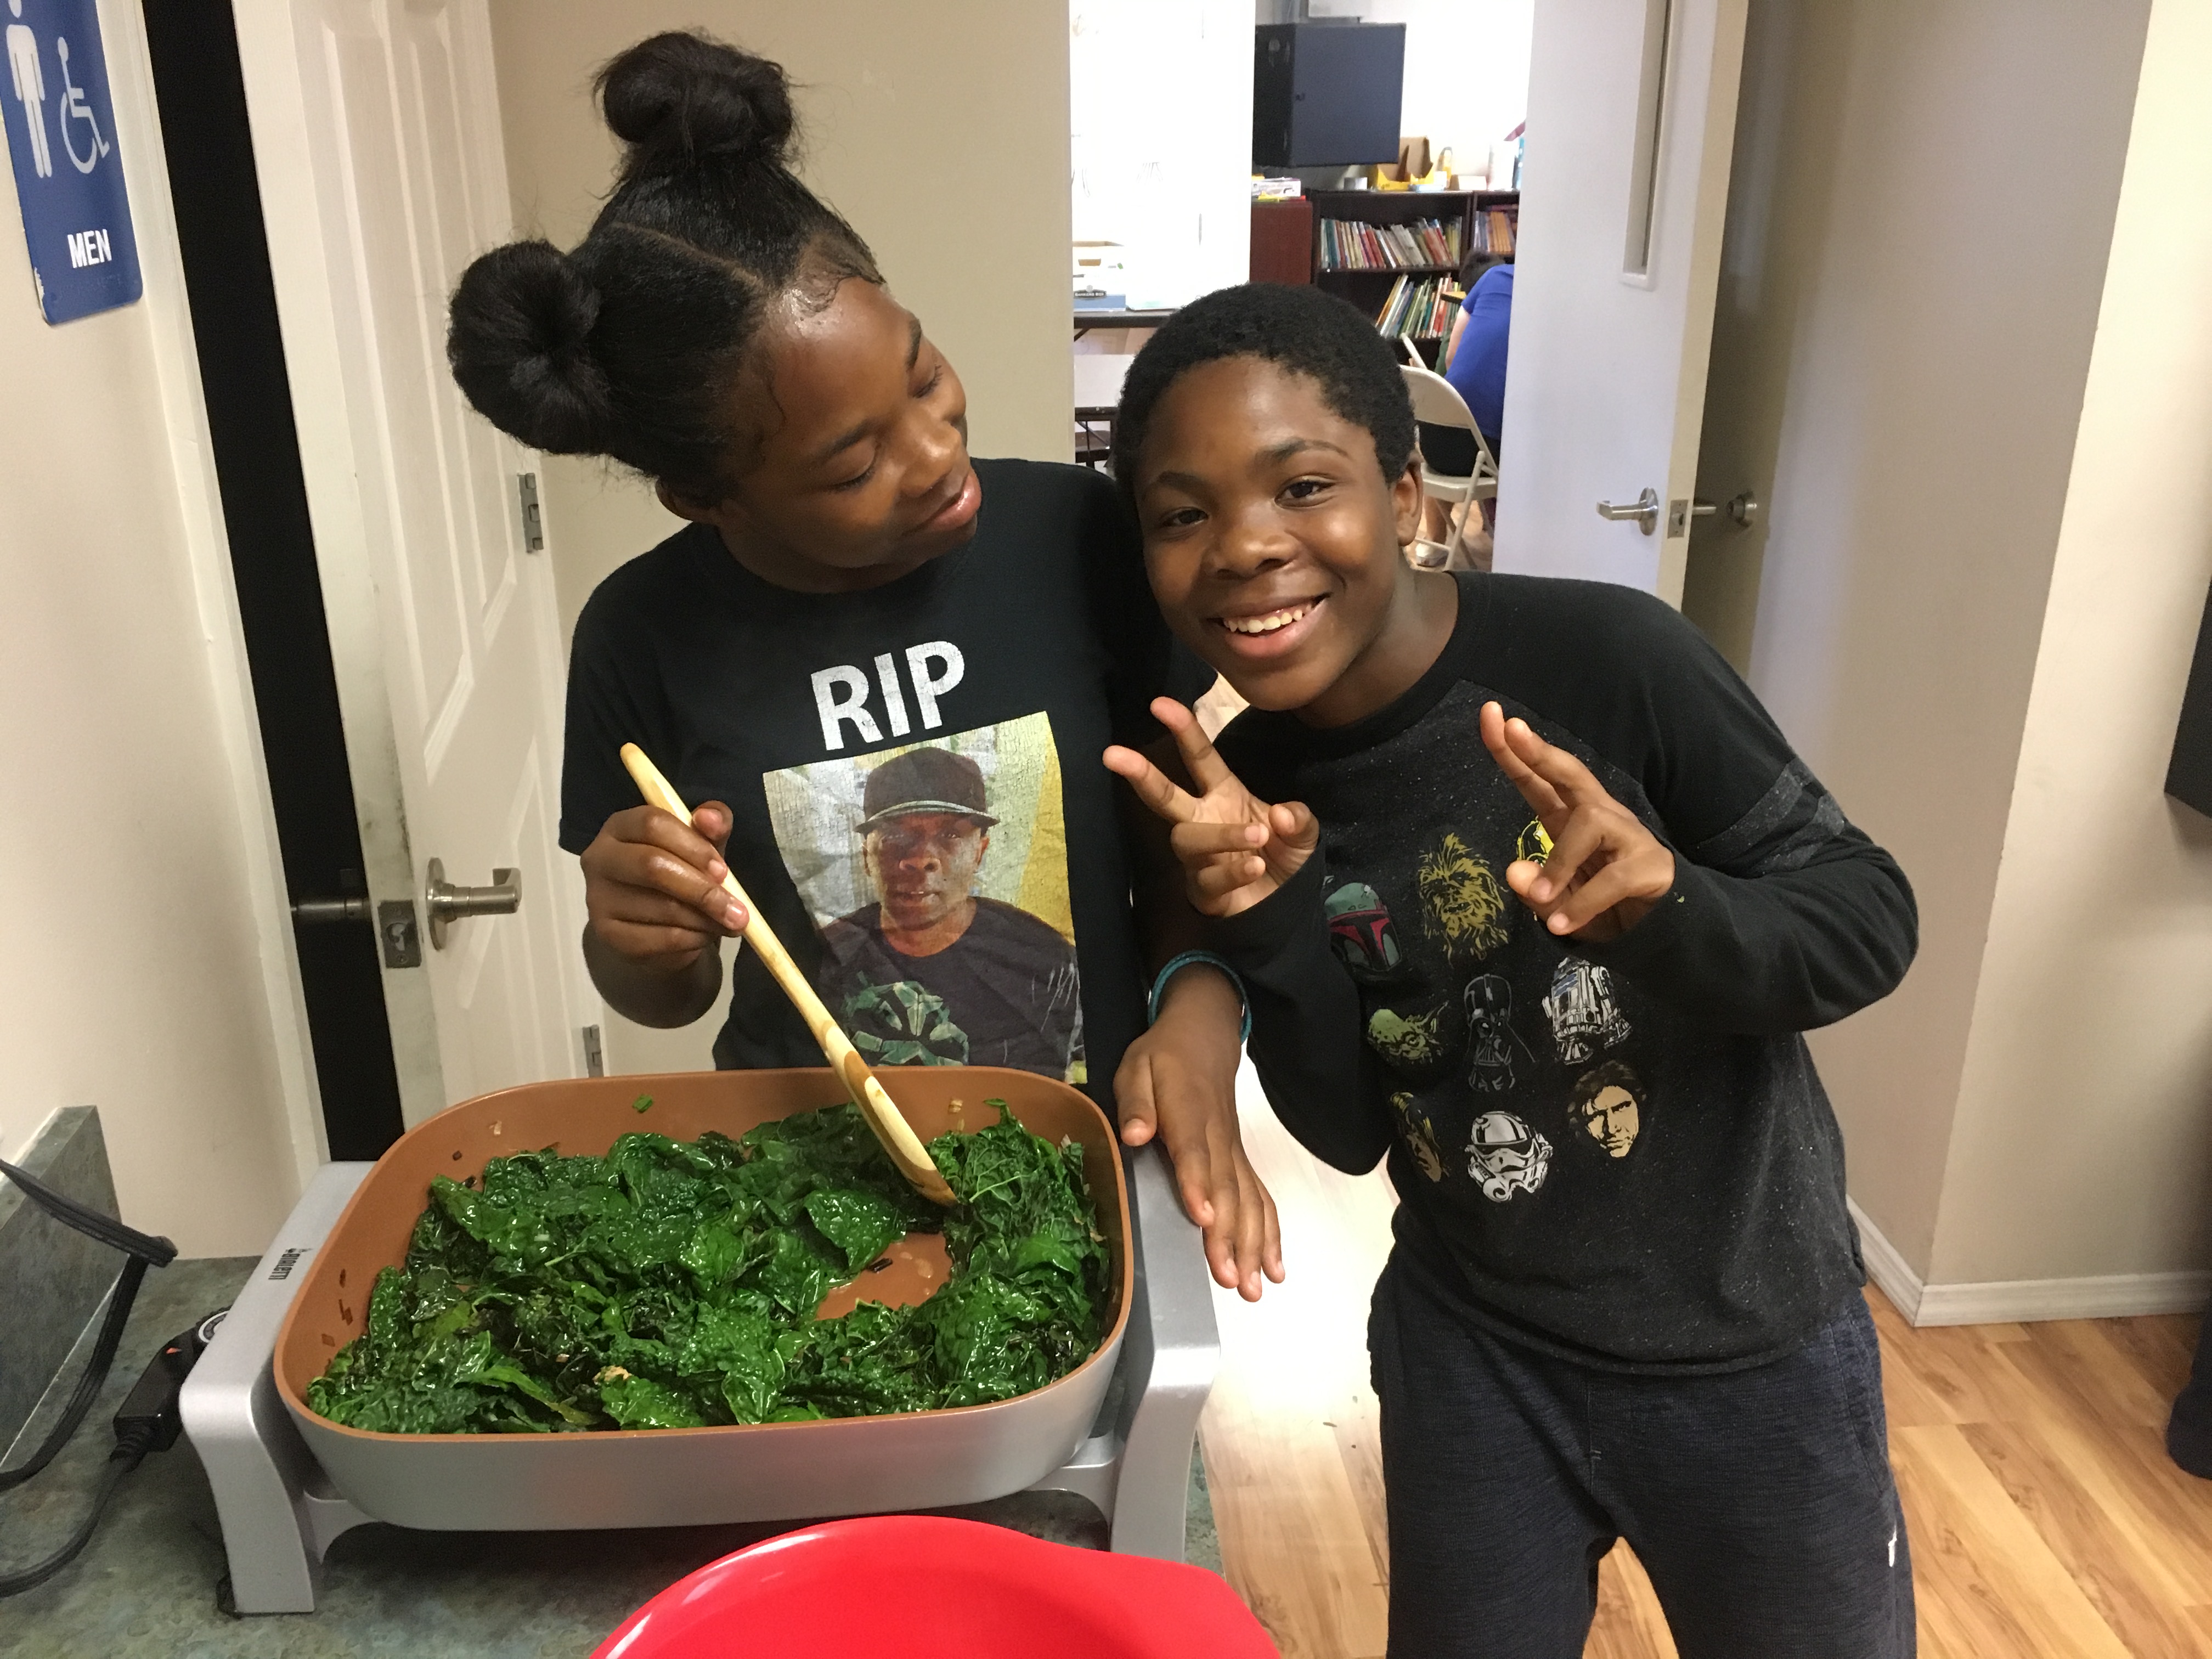
Michelle runs the after school program and works with children. They share their harvest, especially their collard greens. They also make kale chips.
Even the pickiest of eaters will try to start eating fresh vegetables if they participated in growing them. Children who were not willing to eat vegetables have become avid vegetable eaters, even trying to eat the vegetables straight out of the ground before they are washed!
Your content goes here. Edit or remove this text inline or in the module Content settings. You can also style every aspect of this content in the module Design settings and even apply custom CSS to this text in the module Advanced settings.

Website designed by Heron Bridge Education, LLC for Health Initiatives Foundation, Inc. (2020)
Copyright © 2020 AGRR Initiative, Health Initiatives Foundation, Inc., All Rights Reserved


