The CDC’s Theme on Minority Status and Vulnerability is shown on the map above. It combines percent minority population with percent of people who speak English “less than well” into a vulnerability category. The colors on this map tell you where each census tract falls on the vulnerability scale when the housing stock and access to a vehicle are looked at together. Red is highest vulnerability. Yellow is high moderate vulnerability. Green is low moderate vulnerability. Blue is low vulnerability. Click on any icon to read the percentages in each category. The decimal number at the top of the box that appears when you click on an icon is a decimal number between 0 and 1. The larger that number is, the higher the vulnerability is in that census tract.
Community Voice Questionnaire
Minority Status & Language Responses
2021
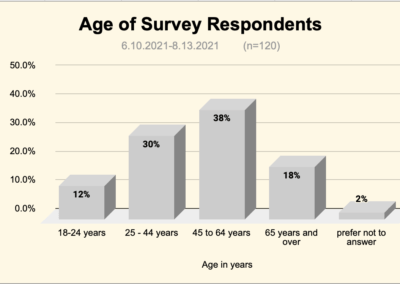
The largest age group was 45-64 years old (38%), followed by 25-44 years old (30%), 65 years and over (18%) and 18-24 years old (12%).
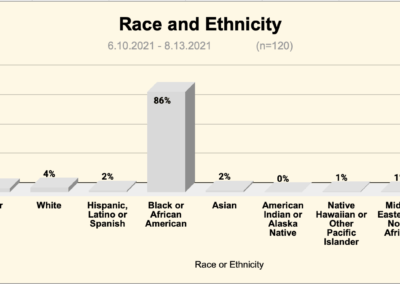
86% of respondents were Black or African American, 4% were White. Both Hispanic, Latino or Spanish and Asians were 2% of respondents. Native Hawaiian or Other Pacific Islanders and Middle Eastern or North Africand were each 1% of respondents.
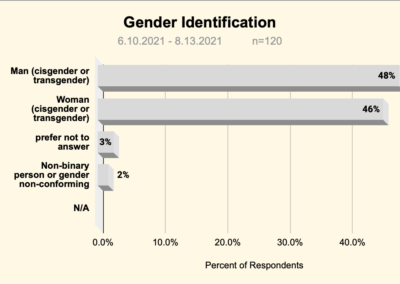
Slightly more men (48%) than women (46%) responded to the survey. 3% preferred not to answer the question. 2% were non-binary or gender non-conforming people.
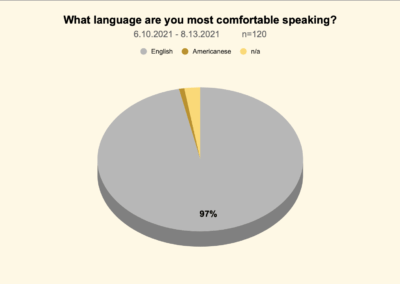
97% of respondents were most comfortable speaking English, with another 1% indicating, “Americanese,” stating ” We are in America; so, we speak Americanese.”
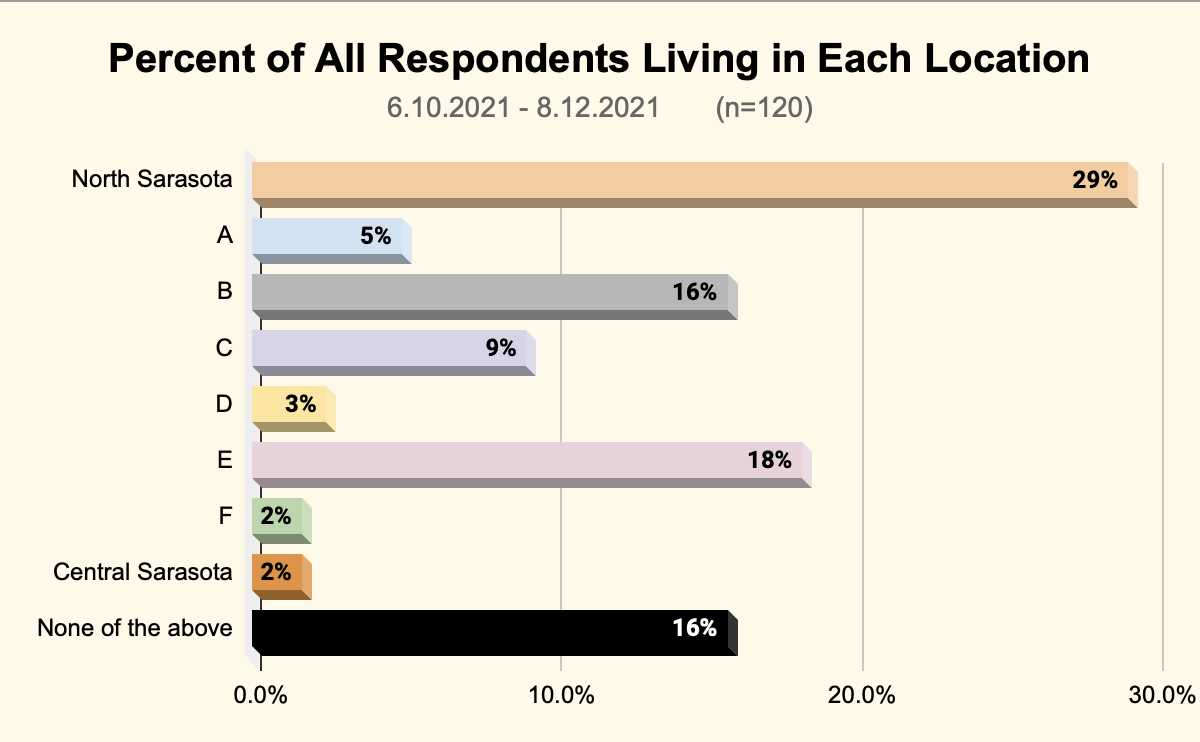
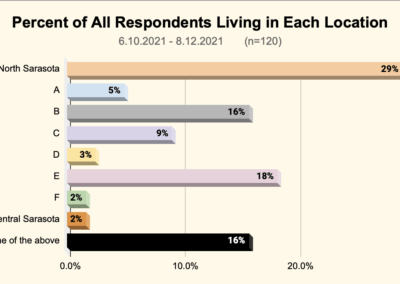
53% of respondents lived in Newtown census block groups A – F. Another 29% live in North Sarasota. Only 2% reside in Central Sarasota.
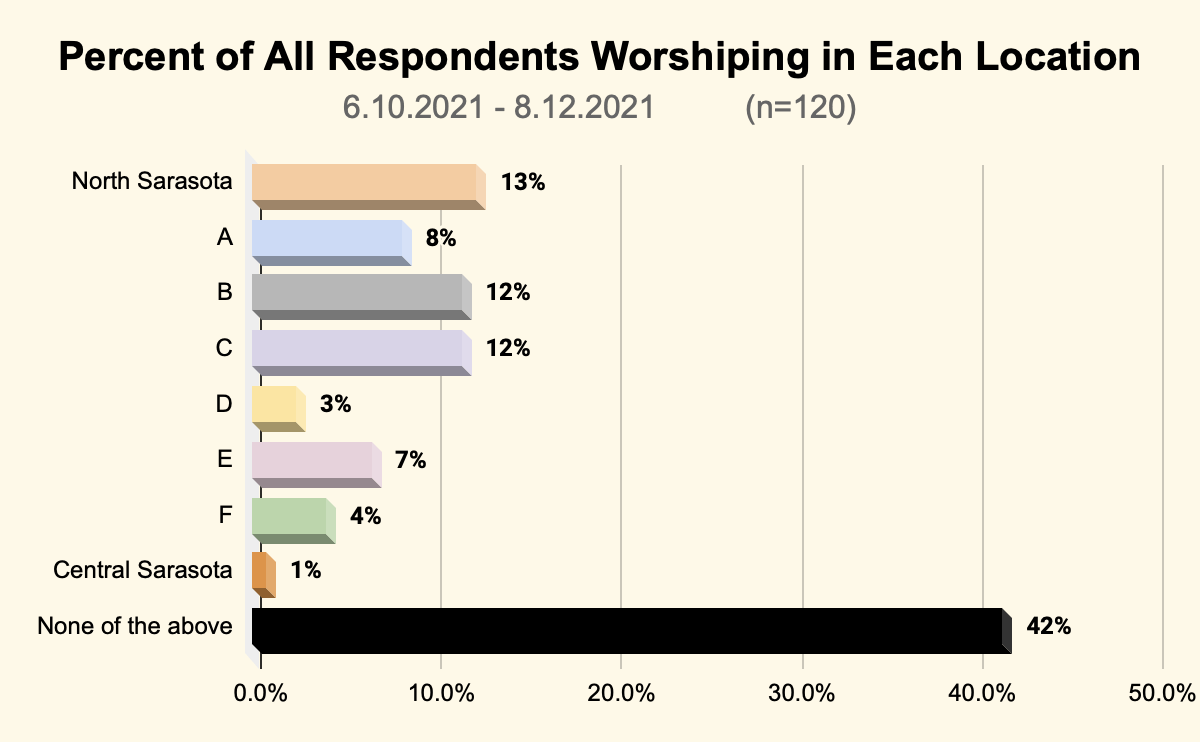
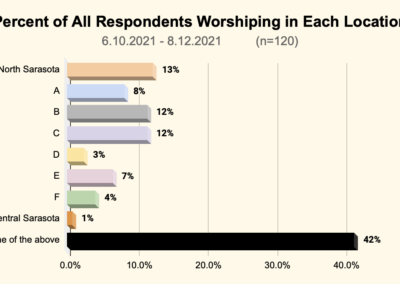
46% of respondents worshipped in Newtown census blocks A-F. 13% lived in North Sarasota and another 1% reported living in Central Sarasota.
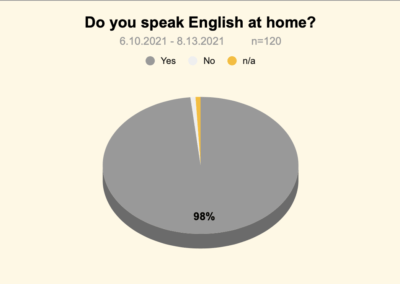
Do you speak English at home?
- Yes 98%
- No 1%
- prefer not to answer 1%
What is your age? ____ years
- 18 – 24 years 12%
- 25 – 44 years 29%
- 45 – 64 years 38%
- 65 years and over 18%
- prefer not to answer 3%
- 5 – extremely stressful 0%
What is your race or ethnicity? (Please select all that apply.):
- White (A person having origins in any of the original peoples of Europe) 4%
- Hispanic, Latino or Spanish (A person of Cuban, Mexican, Puerto Rican, South or Central American, or other Spanish culture or origin.) 2%
- Black or African American (A person having origins in any of the black racial groups of Africa.) 86%
- Asian (A person having origins in any of the original peoples of the Far East, Southeast Asia, or the Indian subcontinent including, for example, Cambodia, China, India, Japan, Korea, Malaysia, Pakistan, the Philippine Islands, Thailand, and Vietnam.) 2%
- American Indian or Alaska Native (A person having origins in any of the original peoples of North and South America (including Central America), and who maintains tribal affiliation or community attachment.) 0%
- Native Hawaiian or Other Pacific Islander (A person having origins in any of the original peoples of Hawaii, Guam, Samoa, or other Pacific Islands.) 1%
- Middle Eastern or North African 1%
- prefer not to answer 2%
Do you identify as (Please select all that apply.)
- Woman (cisgender or transgender) 46%
- Man (cisgender or transgender) 48%
- Non-binary person or gender non-conforming 2%
- Different identity (optional, please state): 0%
- prefer not to answer 3%
What language are you most comfortable speaking?
Responses:
English
“Americanese”
Comments Residents Made About
Minority Status & Language
2021
“Americanese” we do not speak English in America; they speak English over in England. We are in America; so, we speak Americanese.” (Lives in E, Worships in B)
Proud Black community (Worships in B)
No violence in the neighborhood, welcoming Black community (Lives in E)
One of 112 Black communities in the U.S. (Lives and Worships in B, Works in A)
Best community; self-sufficient. Integration harmed community (Lives in B, Worships in North Sarasota)
We had strong leaders; the community took care of each other, fed everybody (no hunger), policed itself, looked after each other and looked after the kids.(Lives in C, Works in A)
Minority & Language Stories
Survey Comments Speak of the Rich Black History of Newtown
The survey comments referenced the rich Black History of Newtown. Community conversation spoke of the need to include interviews and stories gathered in the neighborhood in the Data Story. This space is held for the stories gathered in future efforts to raise the voices of elders and others willing to share their lived history.
Website designed by Heron Bridge Education, LLC for Health Initiatives Foundation, Inc. (2020)
Copyright © 2020 AGRR Initiative, Health Initiatives Foundation, Inc., All Rights Reserved

