Resilient American Communities
Town of Warren
New Hampshire
Building Resilience in Warren
What is Resilience?
The ability to withstand adversity and bounce back from difficult life events.
For communities, the ability of the functions that are critically important to society to recover from natural or manmade hazards can be examined to get a picture of overall community resilience.
We call these Mission Critical Functions.
What is Regeneration?
In ecology regeneration is the ability of the environment and its living population – to renew and recover from damage.
26 Mission Critical Functions
1. Water Distribution Infrastructure
2. Food Security in Disaster Related Events
3. Agricultural Sector Production Scale for Communities
4. Housing Safety
5. Environmental Health and Safety
6. Health Services
7. Shelter in Place and Evacuation Systems
8. Psychosocial Resilience
9. Supply Chains; Logistics
10. Energy Infrastructure – Temperature Management
11. Energy – Lighting and Cooking Infrastructure
12. Renewable Energy vs Grid Energy
13. Education Systems
14. Hygiene and Prevention
15. Communications Systems
16. Sewer/Septic Systems
17. Solid Waste Management
18. Transportation
19. Community Security
20. Community Commons Areas Availability
21. Social services
22. Value Chains
23. Climate Threat Mitigation and Transformation
24. Data and Information Management
25. Emergency Management
26. Management and Governance
Building Resilience and Fostering Regeneration
1. Map resident-identified Assets and Liabilities.
2. Chart resident-identified Gaps and Proposed Solutions.
3. Create a bar chart of the Mission Critical Functions that are resilient and regenerative and those that are vulnerable.
4. Bring the community together for a simulation exercise with future scenarios likely in the geography, to build networks and to provide information for planning.
5. Begin addressing the most vulnerable Mission Critical Functions identified by the community.
Building Resilience in Warren
ACHS has partnered with Resilient American Communities to support community resilience and regeneration in Grafton County. That work is being piloted in Warren, where a variety of materials and activities supporting health and wellness are being developed.
Materials being developed for the library:
- Information kiosks
- Glass display cases with current information on health issues
Libraries are essential to resilience, which requires the capacity to adapt to changing conditions. Our public libraries support these capacities:
- Economic development: Libraries meet the local need for information and creating the building blocks for economic development, such as early literacy services, small business resources and programs, and library buildings where physical development can occur.
- Social capital: Local libraries are networked within the community they serve and with the world of information and its providers at large. Libraries can connect and support community bonds, roots and commitments, and also connect local individuals and groups to others in the county, state or beyond with needed information and resources.
- Information and communication: Our public libraries are locally trusted sources of information.
- Community competence: This is what happens when the first three capacities come together. People come together to contribute to problem-solving in the community, whether they are personal challenges or problems shared by the whole community.
North Country Strong in Warren
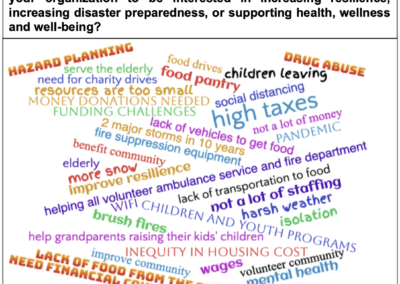
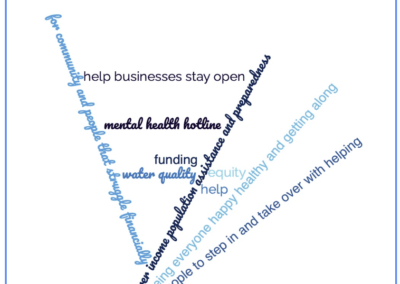
What People in Warren are Saying
We asked and this is what we heard.
Warren, NH Asset Map
If you are a resident of Warren and would like to contribute Assets to the map, please contact LBooherHBE@gmail.com.
Social Vulnerability Index themes:
- Socioeconomic Status (Below Poverty, Unemployed, Income and No High School Diploma)
- Household Composition and Disability (Aged 65 or Older, Aged 17 or Younger, Older than Age 5 with a Disability, and Single-Parent Households)
- Minority Status and Language (Minority and Speaks English “Less Than Well”)
- Housing Type and Transportation (Multi-Unit Structures, Mobile Homes, Crowding, No Vehicle and Group Quarters)
This data is available through the Social Vulnerability Data Map at Census Tract Level. The Social Vulnerability Index Scores appear as blue icons on the map. The scores range from 0 with the least vulnerability to 1, which is the highest vulnerability. The darker the shade of blue of the icon, the greater the vulnerability is in that county. If you click on a county icon, you will see many categories of vulnerability, with information about each. You can also click through to additional data and heat maps at the street level by Census Tract.
The darkest hues of the icons are associated with the greatest numbers of persons 65 or older (pink circles) or 17 years old or younger (black triangles) by Census Tract respectively.
20 Census Tracts with the Highest Social Vulnerability
50 Census Tracts with the Highest # Persons 17 and Younger
2018 CDC Social Vulnerability Data
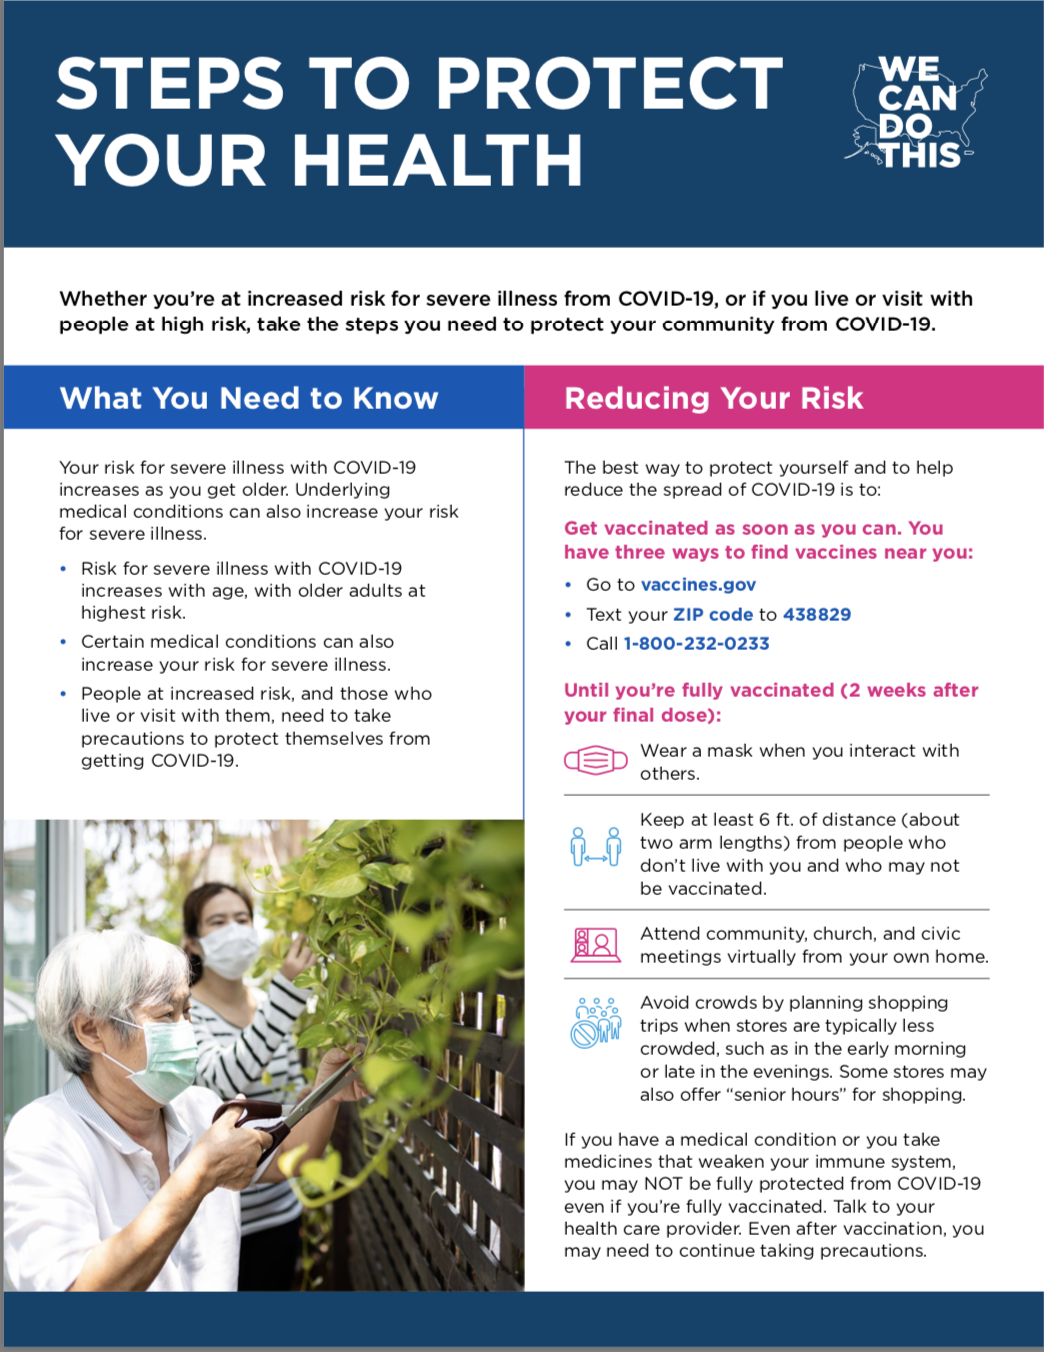
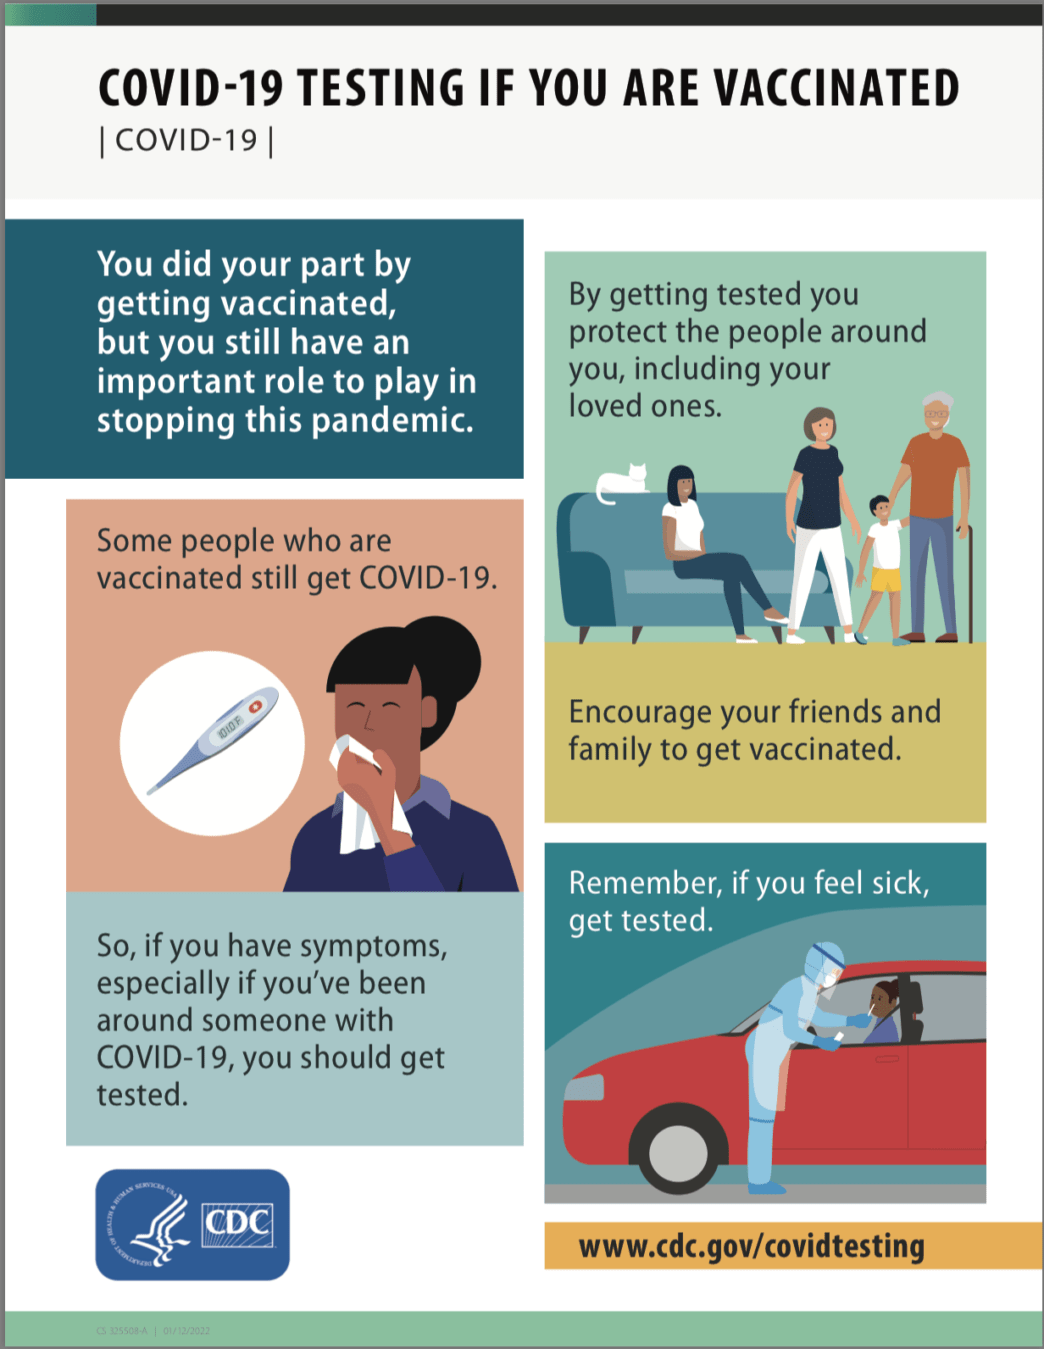
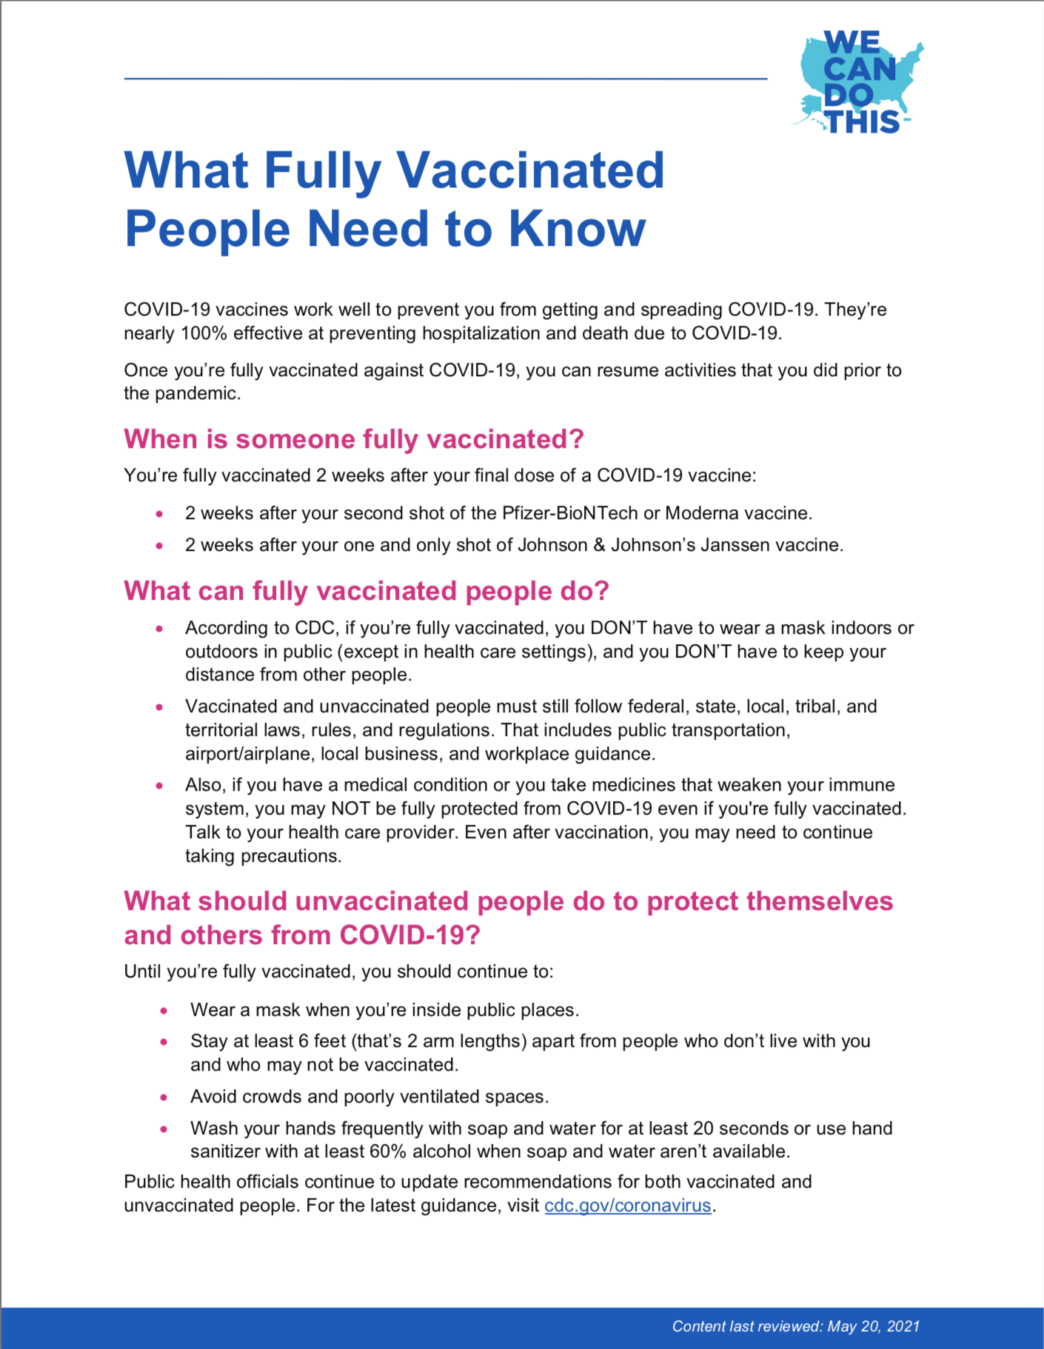
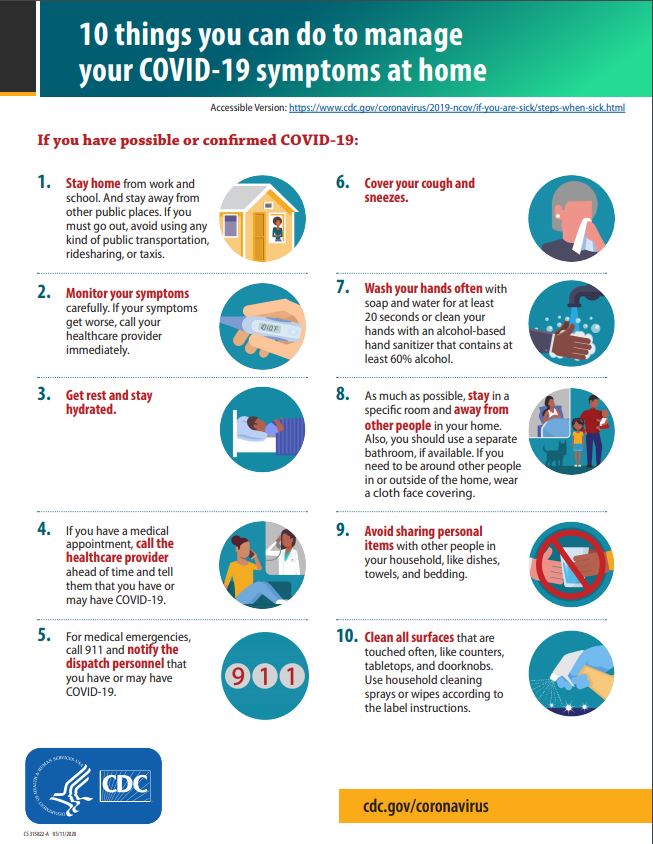
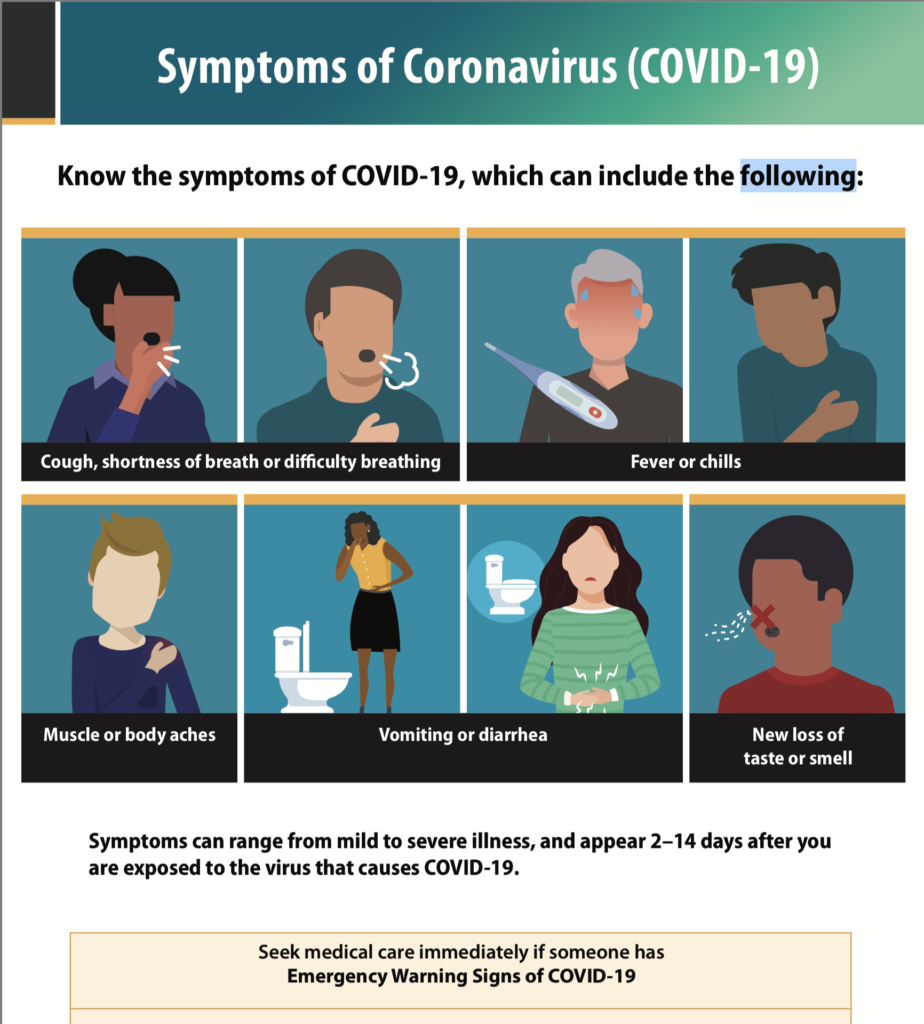
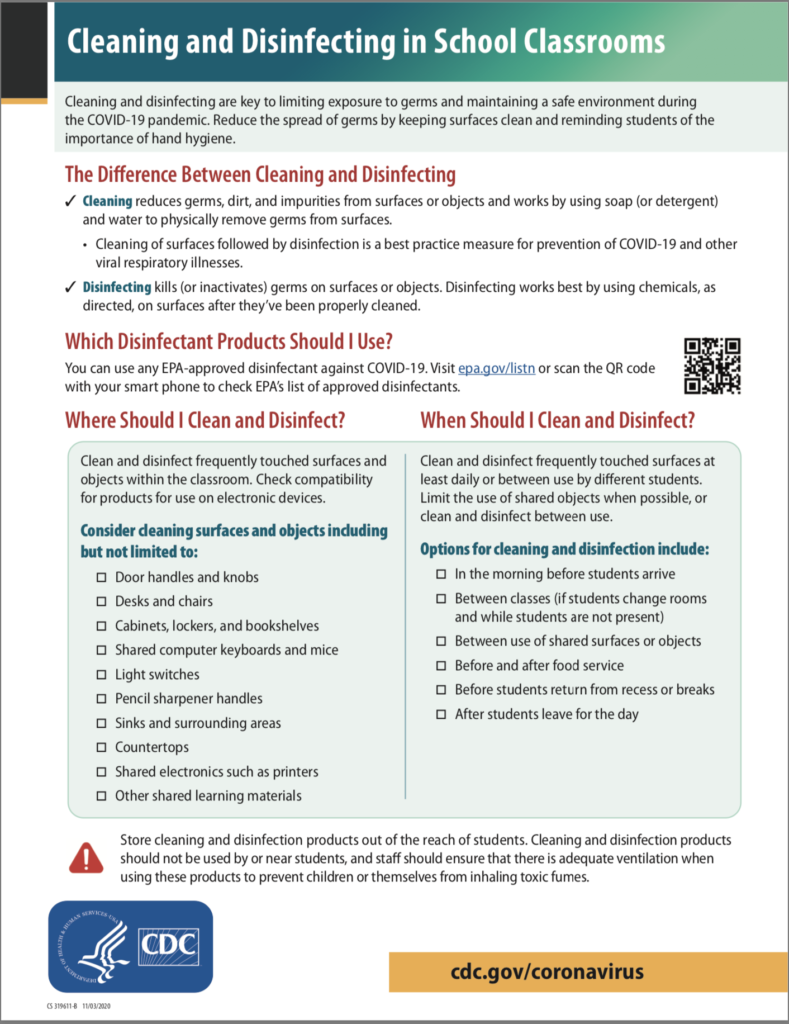
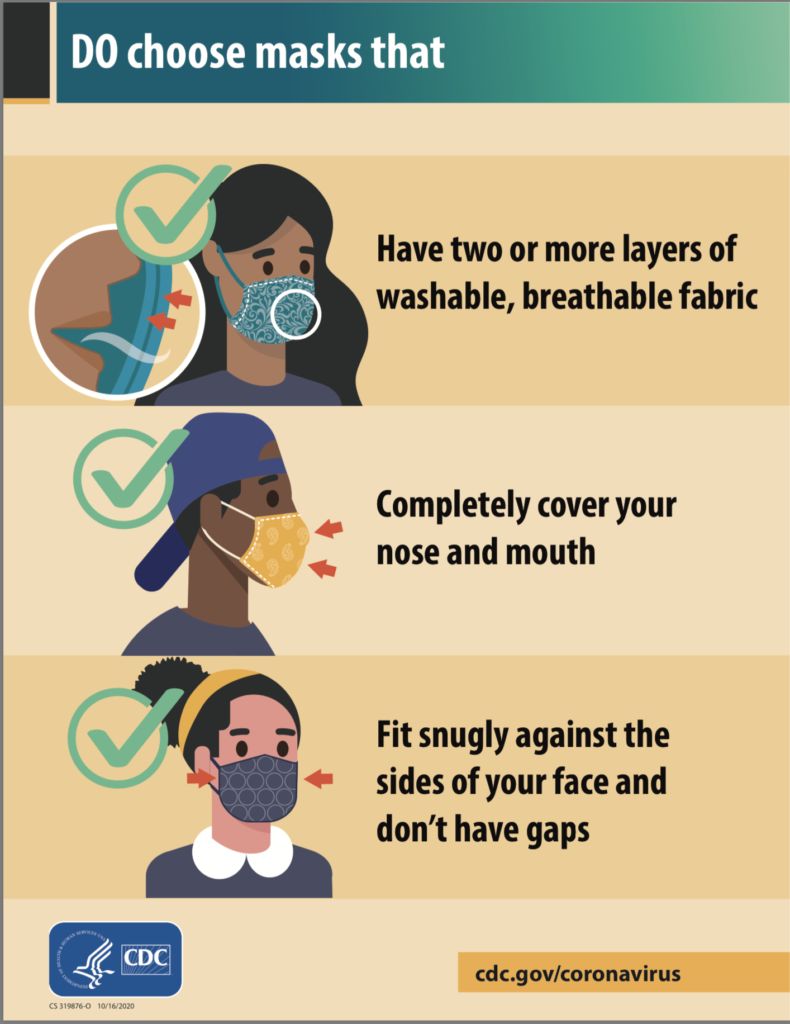
Important Public Health Information
Page last Updated November 19, 2023


Website designed by Heron Bridge Education, LLC
Copyright © 2021, Health Initiatives Foundation, Inc., All Rights Reserved
RAC National Communications
RAC Center of Excellence for Migrant and Immigrant Workers:
RAC BellAge Aging Well Center of Excellence on Aging
RAC Center of Excellence on Social Equity
RAC Center of Excellence on Homelessness
RAC Center of Excellence on Youth
RAC Interfaith Center of Excellence
RAC Center of Excellence for Persons with Disabilities
RAC Workforce Center of Excellence
RAC Region 1 Communications
RAC New Hampshire Communications

