User login
Language
Anonymous's groups in this site
User is not a member of any group.
Your groups across all your sites
User is not a member of any group.
Recent Content
Who's online
There are currently 0 users online.
You are here
Here’s What Global Warming Looks Like Month By Month for 137 Years
Primary tabs
(CLICK ON THE IMAGE BELOW TO ENLARGE)
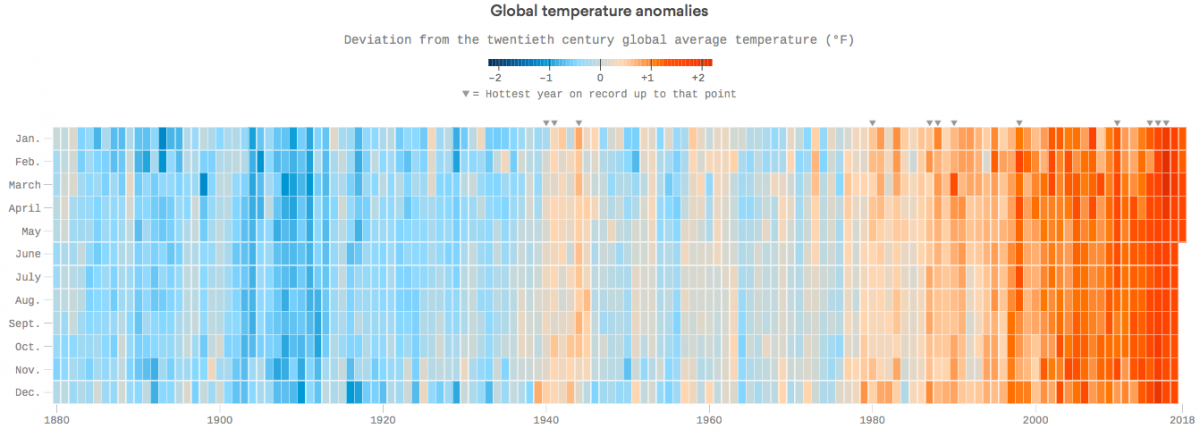
Data: National Oceanic and Atmospheric Administration; Chart: Chris Canipe/Axios
axios.com - by Chris Canipe, Andrew Freedman - June 21, 2018
The Earth is warmer now than at any time since reliable record-keeping began in 1880, and we're continuing to warm at an accelerated rate. In fact, the Earth is warmer now than at any point in modern human civilization.
The context: 2017 was the third-warmest year on record, and the seven warmest years have occurred since 2010. This chart shows temperature anomalies — which is a departure from an average long-term baseline temperature — for every month since January 1880, compared to the average temperature between the years 1901 and 2000. The data is constructed from thousands of available, quality-controlled land and sea surface temperature readings across the world, and runs through May 2018.
(CLICK HERE - READ COMPLETE ARTICLE)
CLICK HERE - NOAA - Climate At A Glance - Global Time Series
CLICK HERE - Climate Science Special Report - Fourth National Climate Assessment (NCA4), Volume I


Recent Comments